Tool Gate · How it works
How the Paid-Lead Breakeven Line gate works
How the Paid-Lead Breakeven Line grades every paid-lead source against the breakeven line your own client value and close rate produce and rolls the spend up to its worst source: a zero-close gate reads a source UNDERWATER when it closed nobody, so the spend reads STOP THE BLEED.
How the gate works
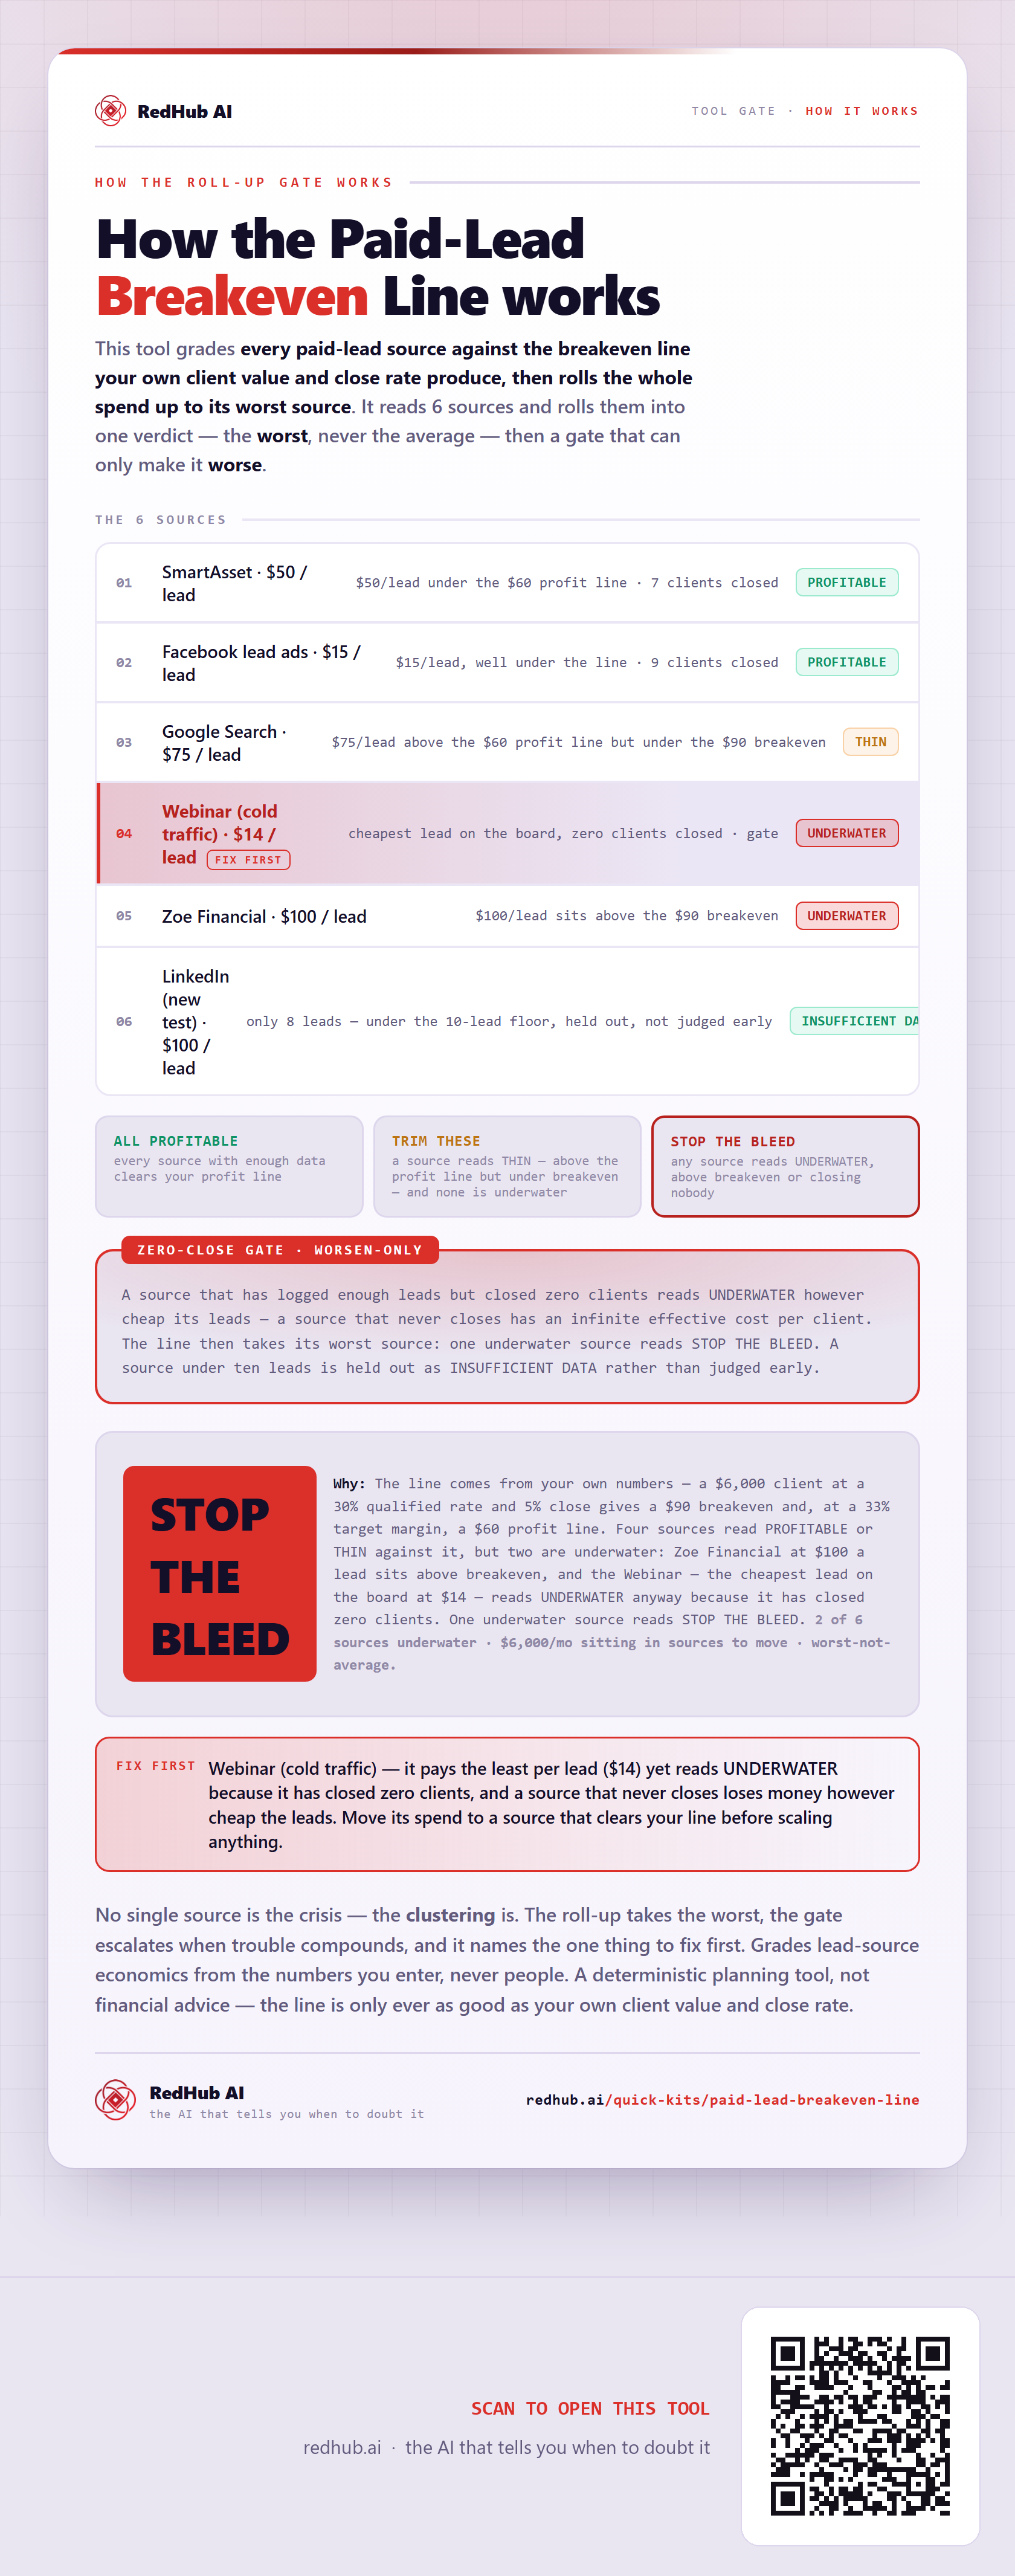
This tool grades every paid-lead source against the breakeven line your own client value and close rate produce, then rolls the whole spend up to its worst source. It reads 6 sources and rolls them into one verdict — the worst, never the average — and then a gate that can only make it worse.
The 6 sources
| Source | Verdict |
|---|---|
| SmartAsset · $50 / lead | PROFITABLE$50/lead under the $60 profit line · 7 clients closed |
| Facebook lead ads · $15 / lead | PROFITABLE$15/lead, well under the line · 9 clients closed |
| Google Search · $75 / lead | THIN$75/lead above the $60 profit line but under the $90 breakeven |
| Webinar (cold traffic) · $14 / leadfix first | UNDERWATERcheapest lead on the board, zero clients closed · gate |
| Zoe Financial · $100 / lead | UNDERWATER$100/lead sits above the $90 breakeven |
| LinkedIn (new test) · $100 / lead | INSUFFICIENT DATAonly 8 leads — under the 10-lead floor, held out, not judged early |
The verdict bands
A source that has logged enough leads but closed zero clients reads UNDERWATER however cheap its leads — a source that never closes has an infinite effective cost per client. The line then takes its worst source: one underwater source reads STOP THE BLEED. A source under ten leads is held out as INSUFFICIENT DATA rather than judged early.
In the worked sample it reads STOP THE BLEED — The line comes from your own numbers — a $6,000 client at a 30% qualified rate and 5% close gives a $90 breakeven and, at a 33% target margin, a $60 profit line. Four sources read PROFITABLE or THIN against it, but two are underwater: Zoe Financial at $100 a lead sits above breakeven, and the Webinar — the cheapest lead on the board at $14 — reads UNDERWATER anyway because it has closed zero clients. One underwater source reads STOP THE BLEED. Marked fix first on this sample: Webinar (cold traffic) — it pays the least per lead ($14) yet reads UNDERWATER because it has closed zero clients, and a source that never closes loses money however cheap the leads. Move its spend to a source that clears your line before scaling anything..
Common questions
Can every source look survivable on the How the Paid-Lead Breakeven Line works and the company still read STOP THE BLEED?
Yes. The roll-up takes the worst of 6 sources — never the average — then a worsen-only gate, the Zero-close gate gate, escalates when trouble clusters. In the worked sample it reads STOP THE BLEED because the line comes from your own numbers — a $6,000 client at a 30% qualified rate and 5% close gives a $90 breakeven and, at a 33% target margin, a $60 profit line. Four sources read PROFITABLE or THIN against it, but two are underwater: Zoe Financial at $100 a lead sits above breakeven, and the Webinar — the cheapest lead on the board at $14 — reads UNDERWATER anyway because it has closed zero clients. One underwater source reads STOP THE BLEED.
What is a worsen-only gate?
A dispositive rule that can only lower a verdict, never raise it. One fatal flaw overrides an otherwise-set of survivable lines, because a single disqualifying gap shouldn't hide behind an average of the healthy ones. Where something is short, the fix-first row names it — here, "Webinar (cold traffic) — it pays the least per lead ($14) yet reads UNDERWATER because it has closed zero clients, and a source that never closes loses money however cheap the leads. Move its spend to a source that clears your line before scaling anything.".
Grades lead-source economics from the numbers you enter, never people. A deterministic planning tool, not financial advice — the line is only ever as good as your own client value and close rate.
Embed this diagram
Free to share and embed with attribution (CC BY 4.0) — keep the link to redhub.ai.
Interactive — renders the live diagram
<iframe src="https://redhub.ai/visuals/tool/paid-lead-breakeven-line.html" title="How the Paid-Lead Breakeven Line gate works — RedHub AI" width="760" height="2057" loading="lazy" style="border:0;width:100%;max-width:760px"></iframe>
<p style="font:14px/1.5 system-ui,sans-serif"><a href="https://redhub.ai/visuals/tool/paid-lead-breakeven-line">How the Paid-Lead Breakeven Line gate works</a> — by <a href="https://redhub.ai">RedHub AI</a>, the AI that tells you when to doubt it.</p>
Image + link — a static picture for any blog
<a href="https://redhub.ai/visuals/tool/paid-lead-breakeven-line"><img src="https://redhub.ai/visuals/tool/paid-lead-breakeven-line-share.png" alt="Diagram of the Paid-Lead Breakeven Line: paid-lead sources graded against a breakeven line and rolled up worst-not-average, a zero-close gate, and the spend reading STOP THE BLEED." width="760" loading="lazy" style="max-width:100%;height:auto;border-radius:16px"></a>
<p style="font:14px/1.5 system-ui,sans-serif"><a href="https://redhub.ai">RedHub AI</a> — the AI that tells you when to doubt it.</p>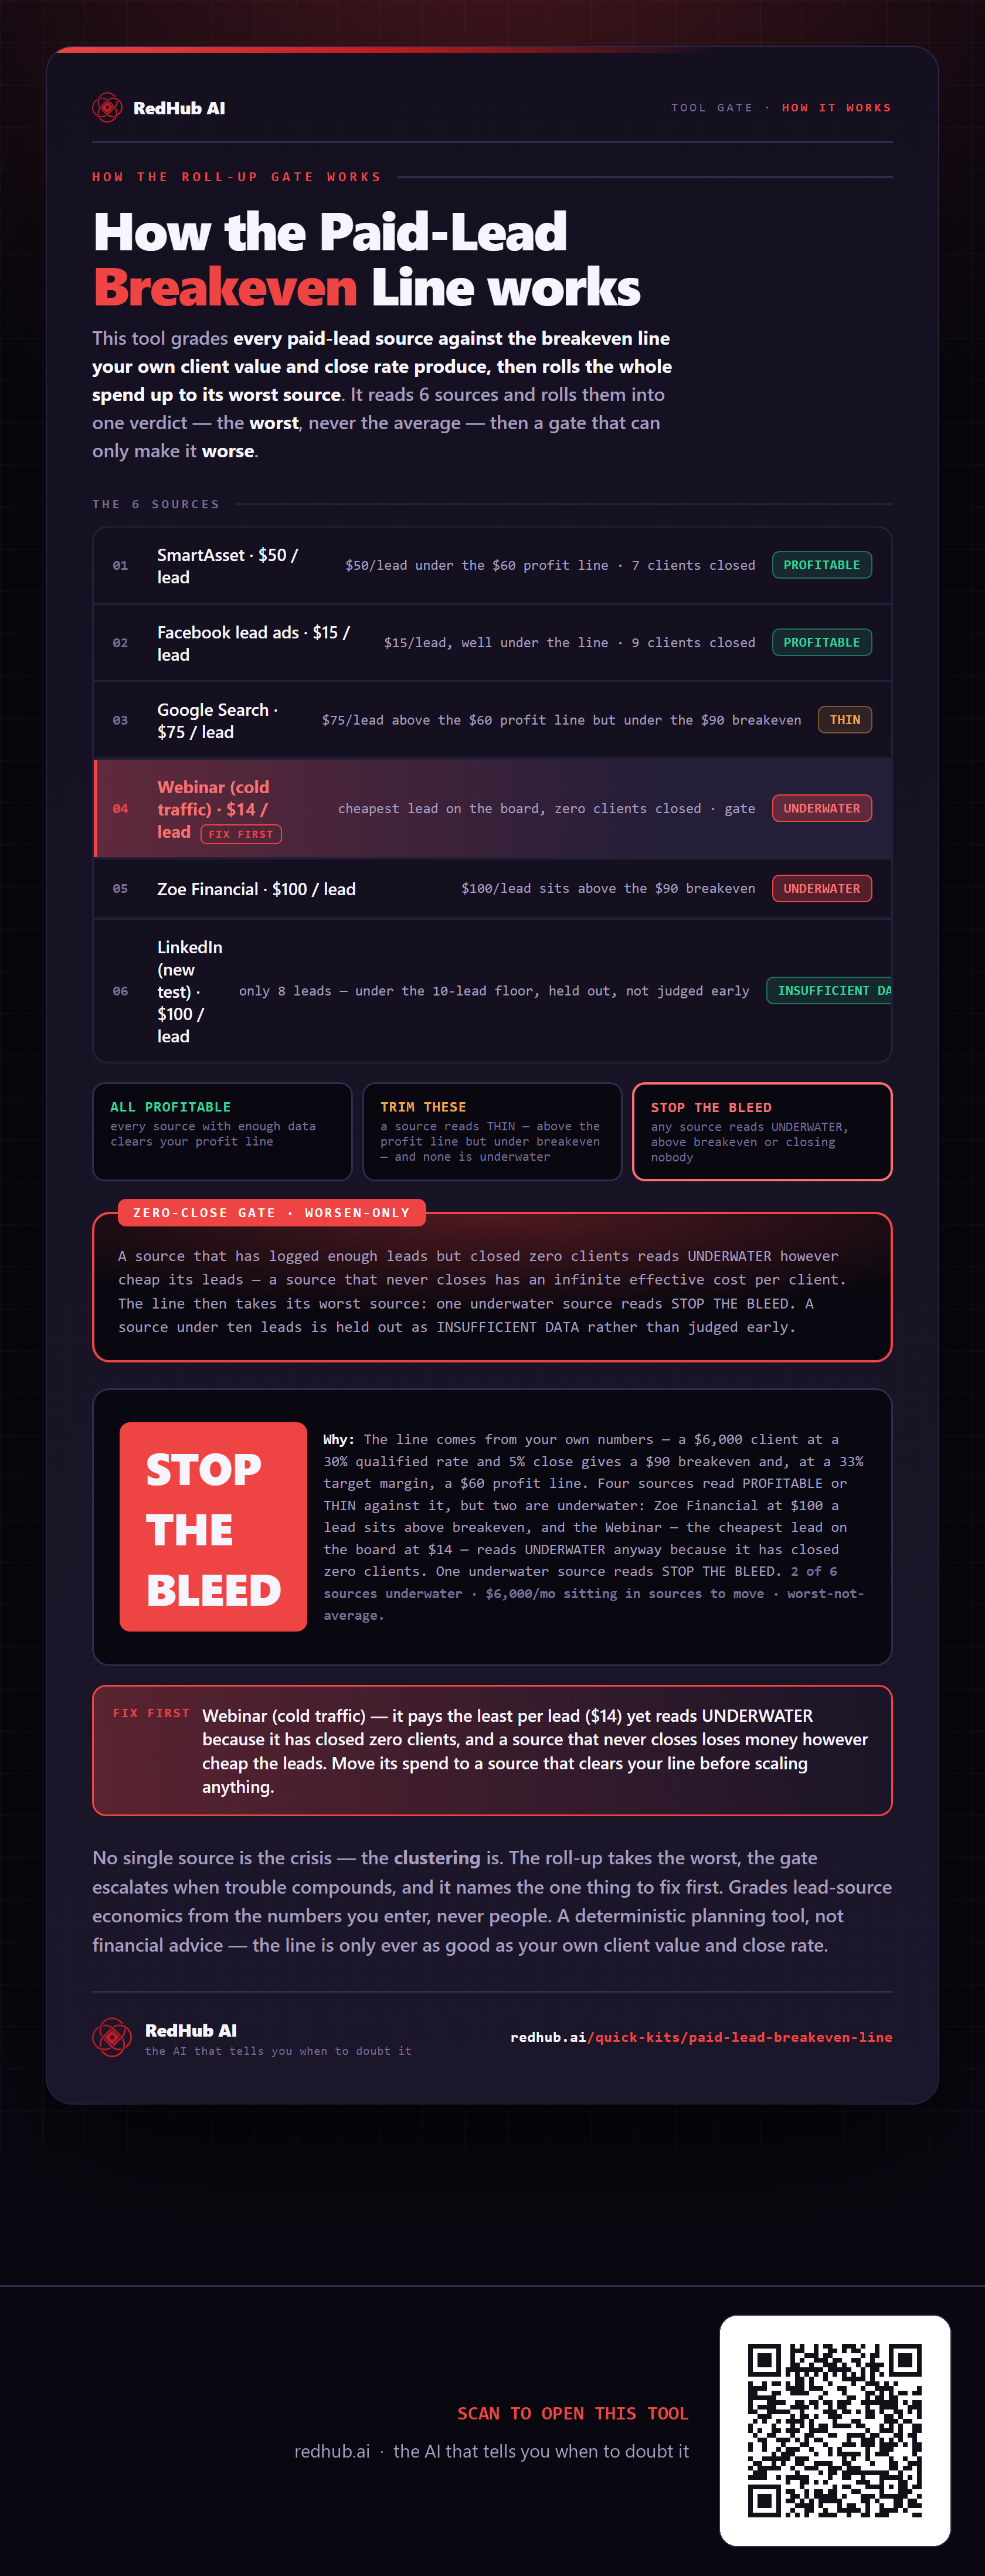
This is how Paid-Lead Breakeven Line works. More diagrams in the Visual Field Guide.