Paid-Lead Breakeven Line
The most you can pay per lead before a source loses money — computed from your own client value and close rates, not an industry benchmark. Then every source you buy reads PROFITABLE, THIN, or UNDERWATER against your line.
instant download · .xlsx · yours to keep
The problem
Cost-per-lead is the number everyone watches — and it lies by itself.
A cheap lead can be your worst buy
A source at $14 a lead looks like a bargain next to one at $90 — until you notice it's never produced a client. The effective cost of a lead that never closes is infinite.
An expensive lead can be your best
If a client is worth enough at your close rate, $100 a lead can be comfortably profitable. Price only means something next to what a lead is worth to you.
Benchmarks aren't your business
An 'average CPL' from a report can't tell you your ceiling. Your line depends on your client value and your close rate — nobody else's.
See it work
Set your economics. Watch every source fall above or below the line.
Set your economics; every source reads against the line they produce.
| Source | Monthly $ | Leads | Clients | Cost/lead | Verdict | |
|---|---|---|---|---|---|---|
| PROFITABLE | ||||||
| PROFITABLE | ||||||
| THIN | ||||||
| UNDERWATER(0 closed) | ||||||
| UNDERWATER | ||||||
| INSUFFICIENT DATA |
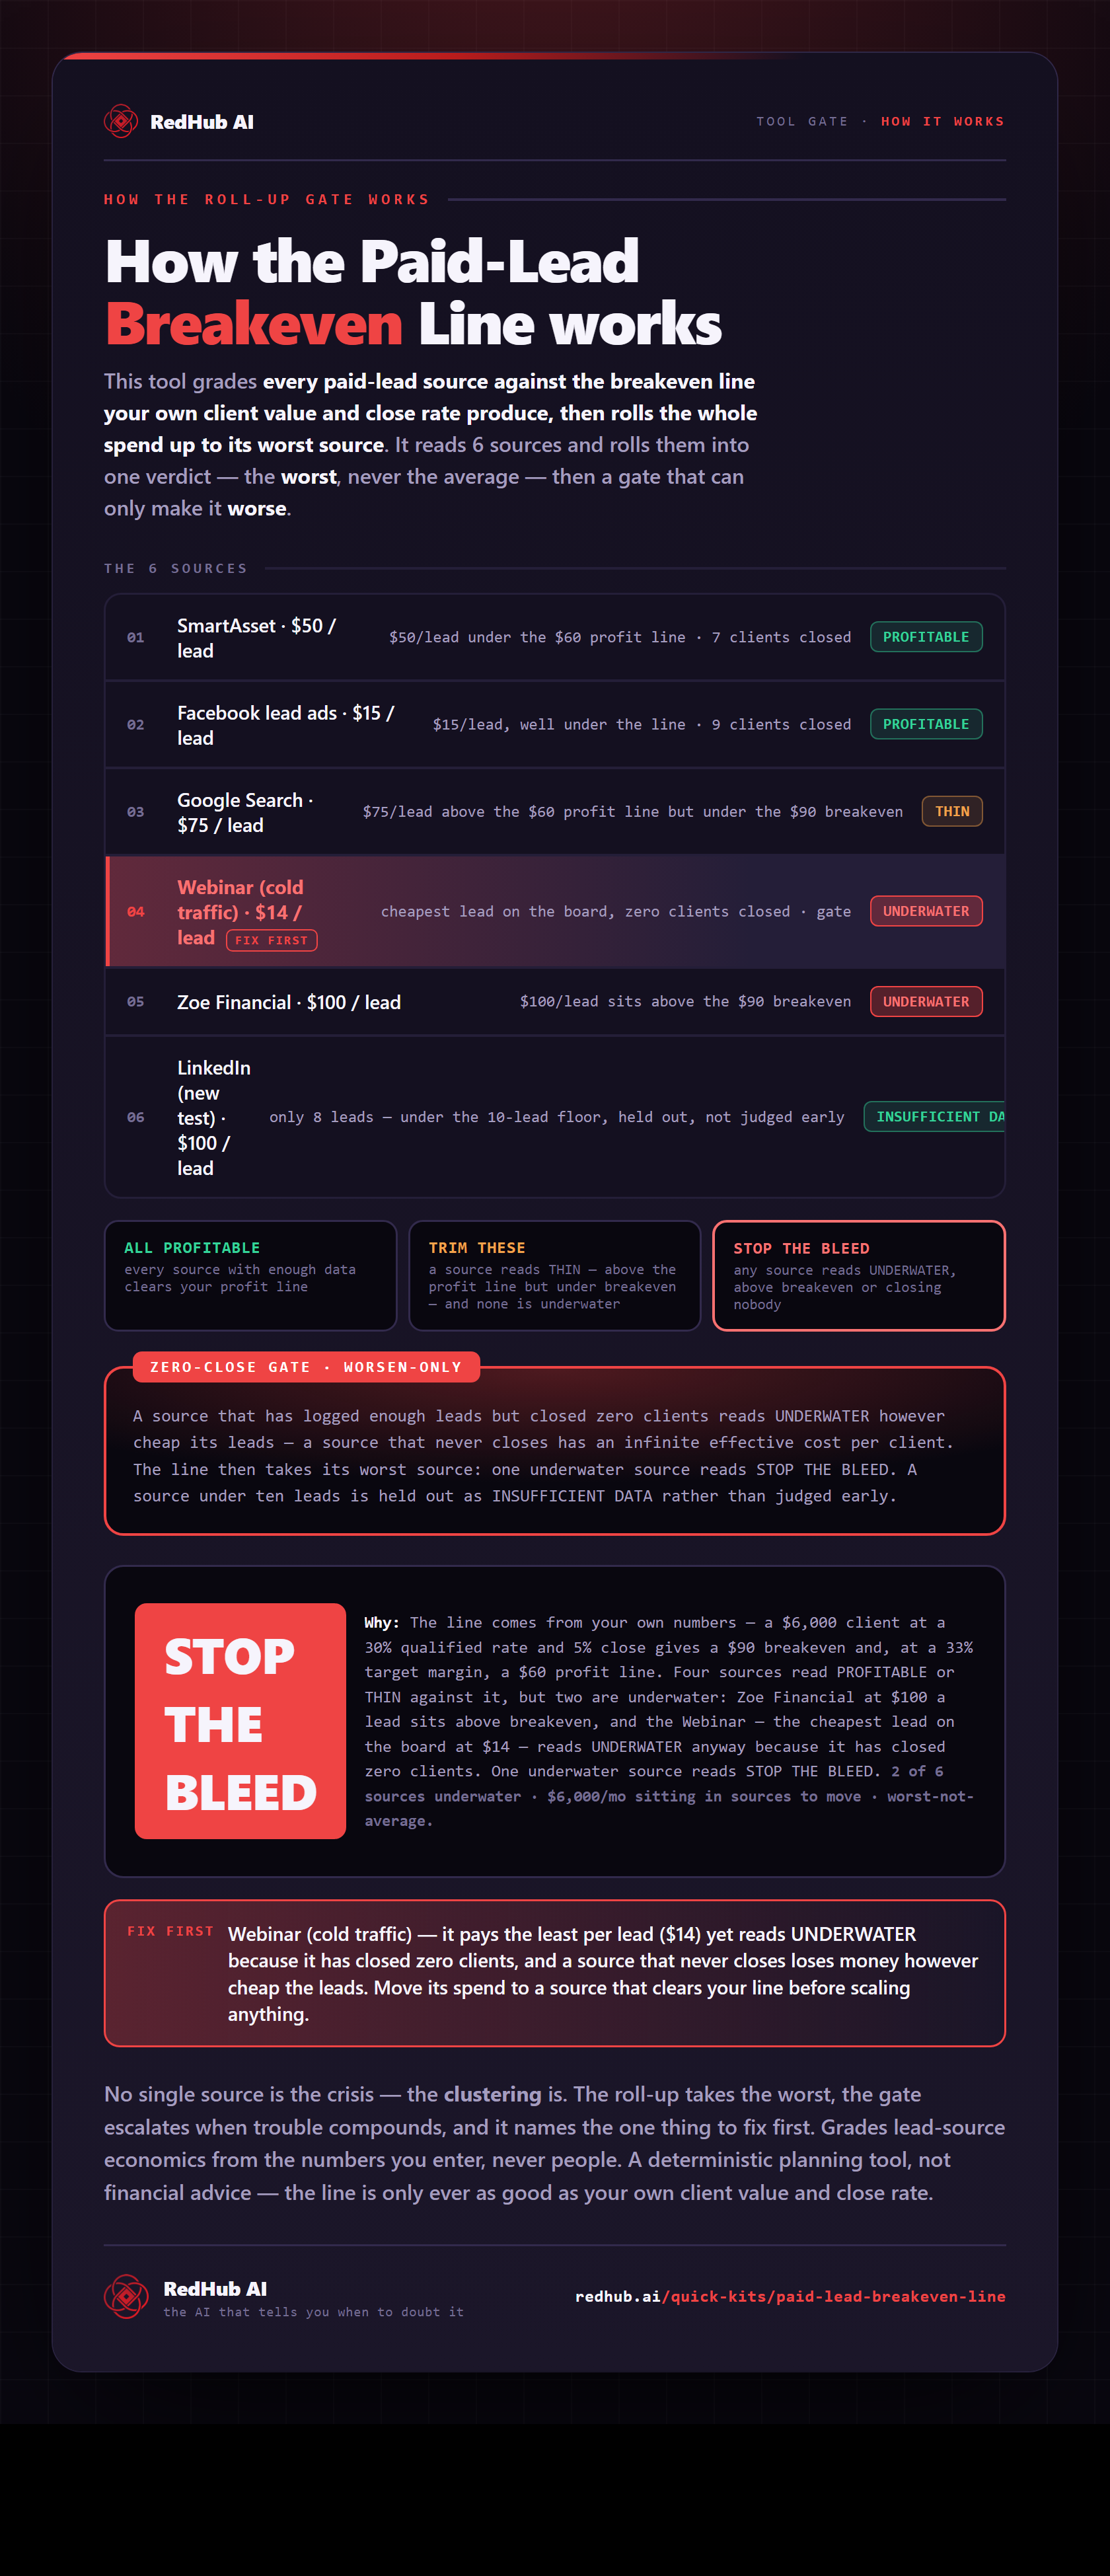
The Webinar row pays the least per lead ($14) yet reads UNDERWATER — it has closed zero clients, and a source that never closes loses money however cheap the leads. The line comes from your own numbers; it grades lead-source economics, never people. Not financial advice.
This is the live engine. Your numbers here reset when you reload. The .xlsx saves your economics and full source list, computes your breakeven and profit lines, reads every source PROFITABLE / THIN / UNDERWATER, and totals the monthly spend to reallocate.
Get the kit — $49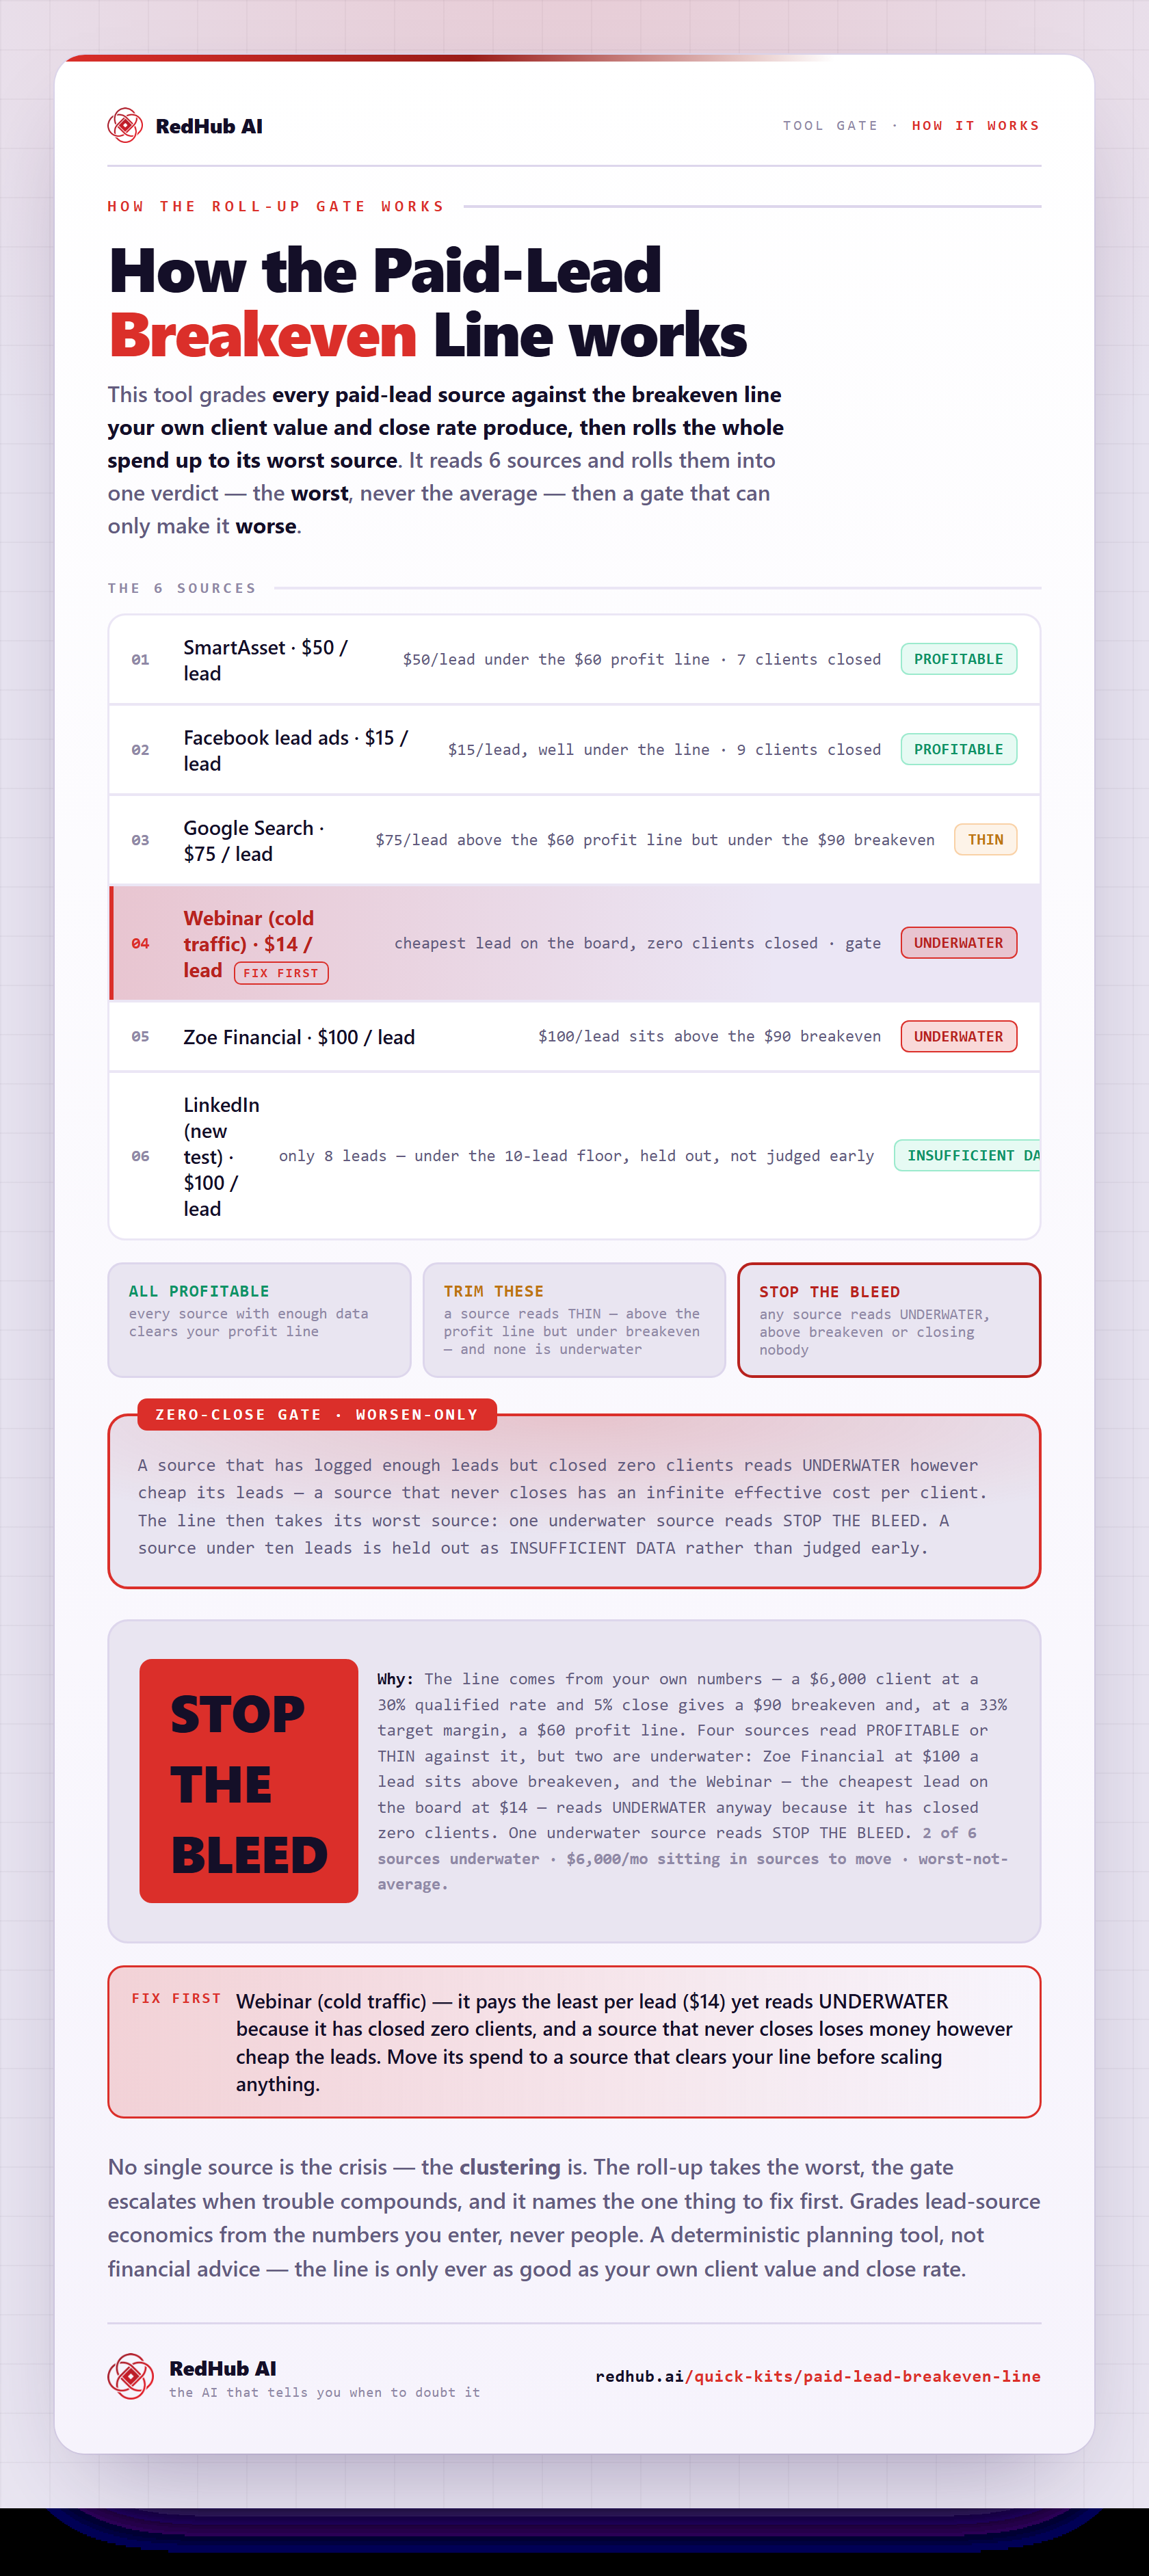
How the gate works, in one image
How the Paid-Lead Breakeven Line grades each source against your breakeven line and reads STOP THE BLEED when a source closed nobody — the same math the demo runs, as a diagram you can share or embed anywhere.
View & embed the full diagramHow the math works
Three lines of arithmetic, all from your own numbers.
Clients per raw lead
Your qualified-lead rate × your close rate. What share of raw leads actually become clients.
Breakeven cost / lead
Client value × clients-per-raw-lead. Pay more than this per lead and the source loses money at your close rate.
Profit line
Breakeven × (1 − your target margin). The ceiling that still leaves the margin you want. Sources read against this.
Two guardrails keep the verdict honest: a source with fewer than 10 leads reads INSUFFICIENT DATA rather than being judged early, and a source that's closed zero clients reads UNDERWATER however cheap its leads — because a source that never closes loses money.
Who it's for
Anyone spending real money on leads.
Advisors & agencies buying leads
SmartAsset, Zoe, Facebook, Google — set your line once and see which vendors actually clear it at your close rate.
Founders running paid acquisition
Decide your max bid before you scale a channel, so you're not discovering the ceiling after the spend.
Marketers defending a budget
Bring the line to the budget conversation: this is the number above which each source loses us money.
Anyone tempted by a cheap-lead pitch
Cheap leads are only a deal if they close. The line tells you whether the price actually works.
Pairs well with
Set the line here; grade yield and payback next door.
Lead Source ROI Scorecard
Grades each source's qualified-lead yield and ROAS after the fact — the yield companion to this kit's ceiling.
ViewCAC & Payback Calculator
CAC, payback period, and LTV:CAC per channel — what a customer cost once you've acquired them.
ViewLead Response-Time Revenue Calculator
The revenue you leave on the table by answering leads slowly — a different lever on the same funnel.
ViewCommon questions
Straight answers before you buy.
Get the kit
Know your line before the next invoice.
- Your breakeven and profit lines, from your own numbers
- Every source read PROFITABLE / THIN / UNDERWATER
- The monthly spend to reallocate, and, where a source is below the line, the one to cut first
- One .xlsx + a bonus CSV engine — no install, no login