Lead Source ROI Scorecard
Some sources flood you with cheap leads that never qualify. Some quietly bring the ones that close. This scorecard grades each source on the metric a CAC calculator skips — how many of its leads are actually a fit — and tells you, honestly, which to SCALE, FIX, or CUT.
- Qualified-lead rate + cost per qualified lead, per source
- SCALE / FIX / CUT from your own numbers
- A fit gate that won't let you scale junk
- Blended ROAS + the exact spend to reallocate
Your cheapest source might be your worst one.
Cost-per-lead and even CAC can flatter a bad channel. A source that floods you with 1,200 cheap leads and closes a couple looks fine on cost — but if only 8% of those leads ever qualify, you're paying your sales team to wade through junk, and the closes are probably luck, not a signal you can scale. The number that separates volume from fit is the qualified-lead rate, and most dashboards never show it by source.
a source can produce leads all day and almost none that qualify. Volume hides the leak.
cost per qualified lead catches a bleeding source before it shows up diluted in blended CAC.
the verdict reads your own qualified-lead numbers — no industry multiplier, no guess.
Watch a profitable source get gated.
This is the scorecard's exact math on one source. It's making money — but raise its qualified leads above the fit floor and watch the verdict change.
This source is profitable (good ROAS) but most of its leads don't qualify. Watch the verdict when you raise the qualified leads above the fit floor.
The verdict is from your own qualified-lead counts — no industry multiplier. A planning tool, not financial advice.
This is the live engine. Score every lead source side by side, not one at a time See your blended ROAS and the exact spend to reallocate Tune the fit floor and ROAS thresholds to your business
Get the kit — $49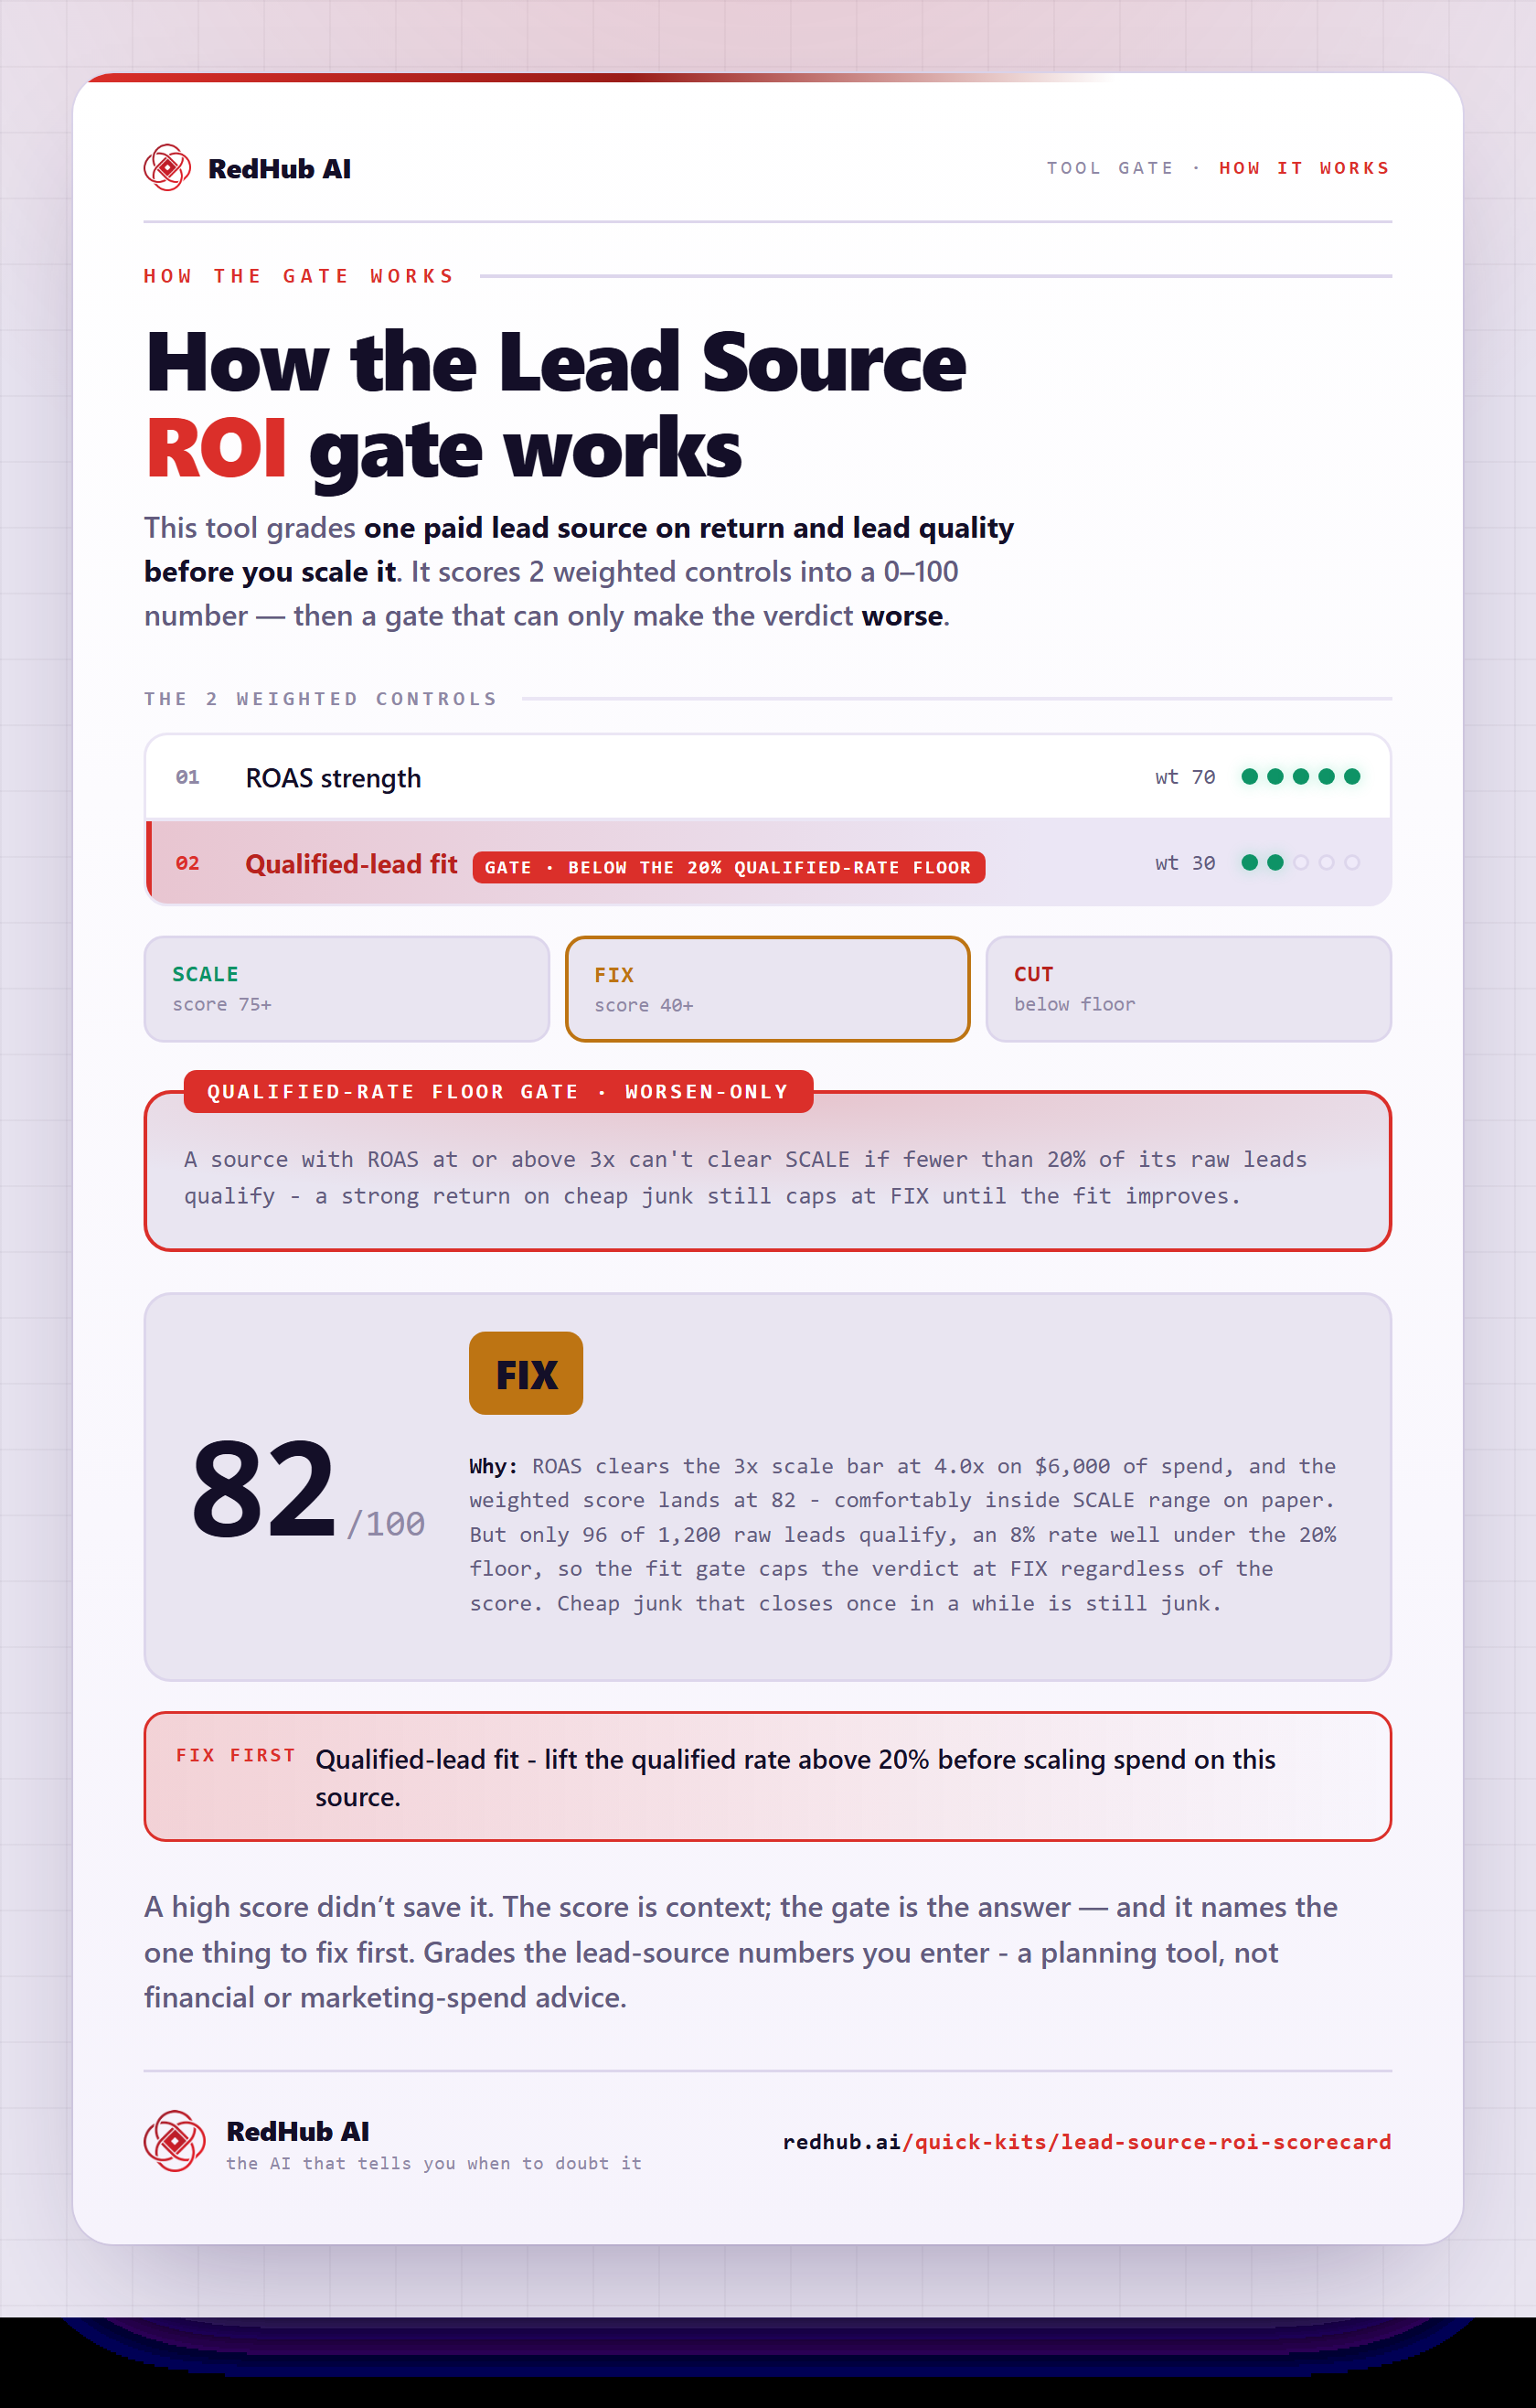
How the gate works, in one image
How the Lead Source ROI Scorecard scores a paid source on ROAS and lead fit and caps a profitable-but-unqualified source at FIX — the same math the demo runs, as a diagram you can share or embed anywhere.
View & embed the full diagramTwo dimensions, one honest gate.
- SCALE — good fit (qualified rate ≥ your floor) and a strong return (ROAS ≥ your threshold). Pour more in.
- FIX — one good dimension, not both: profitable but poor fit, or good fit but losing money.
- CUT — losing money and poor fit. Reallocate the spend.
You set the fit floor and the ROAS thresholds, so the verdict reflects your business.
A source whose qualified-lead rate is below your floor cannot earn SCALE — no matter how high its ROAS. Cheap junk that gets lucky on a couple of closes is still junk; scaling it just buys more junk.
Five numbers per source. The rest is computed.
For each lead source, type spend, raw leads, qualified leads, closes, and average deal value. One row per source.
The scorecard computes qualified rate, cost per qualified lead, close rate, CAC, revenue, and ROAS, then returns SCALE / FIX / CUT — with the fit gate applied.
The Dashboard shows blended ROAS, blended cost per qualified lead, your top source, and the exact spend sitting in CUT sources to reallocate.
Qualified rate = qualified ÷ raw leads (your fit signal) · Cost per qualified lead = spend ÷ qualified (upstream of CAC) · Close rate = closes ÷ qualified · ROAS = revenue ÷ spend. Every cell is a live formula — change an input and the verdict updates.
A fit scorecard, not a CAC calculator.
- A workbook that grades lead sources on qualified-lead yield, not just cost.
- A per-source SCALE / FIX / CUT verdict with an honest fit gate.
- The spend-to-reallocate number, computed from your own data.
- Editable thresholds — your floor, your ROAS bars.
- Not a CAC calculator. For CAC, payback, and LTV:CAC per channel, use the CAC & Payback Calculator.
- Not a lead source — it grades the sources you already run.
- Not a way to launder junk volume into a SCALE — the fit gate exists to stop that.
- Not financial advice; the numbers and the verdict are yours.
This is a planning tool that organizes your own lead-source numbers. It isn't financial, accounting, or investment advice.
Anyone spending across more than one lead source.
- Founders and marketers splitting budget across ads, referral, email, and more.
- Anyone whose cheapest channel might be quietly wasting their sales team's time.
- Operators who track qualified leads (or can) and want a fit-weighted verdict.
- Agencies reporting on which client channels actually produce qualified pipeline.
- Teams who only need acquisition cost — that's the CAC & Payback Calculator.
- Anyone without a count of qualified leads per source (you'll need that input).
- Screening people for jobs, housing, or credit — this grades ad spend, not people.
Find the sources, then work the leads.
The cost side: CAC, payback, and LTV:CAC per channel. This scorecard finds the fit; that one prices the acquisition. Run both.
ViewOnce you know which sources bring qualified leads, score the leads themselves PURSUE NOW / NURTURE / DISQUALIFY.
ViewCapture more from the sources that work — grade the opt-in page your lead magnet lives on.
ViewStraight answers.
Lead-quality yield by source. For each lead source you enter spend, raw leads, qualified leads, closes, and average deal value; the workbook computes your qualified-lead rate (how many of a source's leads are actually a fit), cost per qualified lead, close rate, CAC for context, revenue, and ROAS — and returns SCALE, FIX, or CUT for each source. The verdict comes from your own qualified-lead counts, not an industry benchmark.
A CAC calculator measures the cost to acquire a customer — it goes from spend straight to closes and can't see the lead-quality step in between. This scorecard grades that step: which sources bring leads that qualify (fit) and which bury your team in junk volume that closes once in a while. Cost per qualified lead sits upstream of CAC and catches a leaking source before it shows up diluted in your blended numbers. Use the CAC calculator for acquisition economics; use this to find the sources worth feeding the CAC calculator.
Because of the qualified-rate floor — the honest gate. A source whose qualified-lead rate is below your floor (default 20%) can't earn SCALE no matter how high its ROAS, because cheap junk that gets lucky on a couple of closes is still junk. Scaling it just buys more junk and wastes your sales team's time on leads that never had a shot. The fix is to lift the fit first; once the qualified rate clears the floor, the source can earn SCALE.
Two dimensions: fit (your qualified-lead rate vs your floor) and return (ROAS vs your thresholds). SCALE means good fit and a strong return. CUT means losing money and poor fit. FIX is everything in between — a profitable source with poor fit (tighten targeting before you trust it), or a good-fit source that's losing money (fix the cost or the conversion). You set the floor and the ROAS thresholds, so the verdict reflects your business, not a baked-in rule.
One polished Excel workbook with three tabs: a Start Here primer, a Dashboard that shows your blended ROAS, blended cost per qualified lead, the spend sitting in CUT sources to reallocate, and your top source by ROAS — and a Source Scorecard where you enter your sources and read the per-source verdict. Every number is a live formula; edit your inputs and everything updates. It works in Excel, Google Sheets, or Numbers.
No. It's a planning tool that organizes your own lead-source numbers into a clear picture and a per-source verdict. The math and the thresholds are transparent and editable, and every output comes from the figures you enter. Use it to inform your own budget decisions — it isn't financial, accounting, or investment advice.
Stop scaling your cheapest junk.
One workbook, three tabs, your own numbers. Find the sources that bring fit, see the spend to reallocate, and give every channel an honest verdict.
one-time · instant download · works in Excel, Google Sheets, or Numbers
Sold by RedHub AI LLC · Secured by Stripe · redhub.ai