CAC & Payback Calculator
CAC, payback period, LTV, and LTV:CAC for every acquisition channel — with an invest / hold / cut verdict. Your blended average is hiding the truth.
TL;DR
Blended CAC is an average, and averages hide the channels losing money. In the example, referral pays back in 0.6 months at 38:1 while influencer one-offs run 0.77:1 and lose money on every customer — $5,000/mo waiting to be reallocated.
instant download · .xlsx · 30-day guarantee
The problem
“Our CAC is fine.” Maybe. The average is lying to you.
Blended CAC tells you what acquisition costs on average — and averages bury the channels quietly losing money on every customer. One channel can pay back in three weeks while another takes 16 months, and the single number hides both.
Break it down per channel with payback period alongside LTV:CAC, and the decisions appear: where to pour more in, where to hold, and which spend to reallocate today.
best channel's LTV:CAC in the example — 0.6-month payback
worst channel — loses money on every customer acquired
blended CAC that hides both extremes
monthly spend in Cut channels, waiting to be reallocated
Example figures are computed live from the workbook's seeded sample channels — not a claim about any real business.
What's inside
One sheet. Unit economics for every channel.
One .xlsx — open it in Excel, Google Sheets, or Numbers and rank your channels today.
Channels tab
List every acquisition channel. Enter spend, new customers, gross margin per customer per month, and lifespan; the sheet returns CAC, payback, LTV, LTV:CAC, and a verdict for each — example data filled in, ready to overwrite.
Acquisition Dashboard
Blended CAC, total monthly spend, total new customers, and the standout line — the exact monthly spend sitting in Cut channels you could reallocate to Invest channels today.
The verdict
Every channel gets one of three calls — Invest, Hold, or Cut — from its LTV:CAC ratio and payback period together, not a single average.
Payback period, surfaced
The metric most CAC math skips and CFOs live by — how many months until a channel's customer pays back what it cost to acquire them, computed per channel.
How the verdict works
Ratio and payback, then the call
CAC is spend over new customers; payback is CAC over monthly margin; LTV is monthly margin times lifespan. The ratio and the payback together set the verdict:
- Invest — LTV:CAC of 3+ and payback within 12 months — pour more in
- Hold — workable but not strong — tighten CAC or lift retention before scaling
- Cut — LTV:CAC under 1, or payback beyond 18 months — reallocate the spend
The built-in example · 5 channels
Same blended average, five very different channels — the per-channel verdicts are where the decisions live.
Try it
Break acquisition down by channel
Blended CAC
$212
Spend in Cut channels / mo
$5,000
Invest / Hold / Cut
2 / 2 / 1
Total monthly spend
$23,500
This is the live engine. Your numbers here reset when you reload. The kit saves every channel, computes CAC, payback, LTV and LTV:CAC, and shows the exact monthly spend sitting in Cut channels you could reallocate today.
Get the kit — $49| Channel | Spend | Cust. | GM/mo | Life mo | CAC | Payback | LTV:CAC | Verdict |
|---|---|---|---|---|---|---|---|---|
| $25 | 0.6mo | 38.4 | Invest | |||||
| $100 | 2.5mo | 9.6 | Invest | |||||
| $250 | 6.6mo | 2.3 | Hold | |||||
| $320 | 8.0mo | 2.3 | Hold | |||||
| $625 | 15.6mo | 0.8 | Cut |
Margin per customer and lifespan are your estimates. Gross-margin LTV (not discounted/NPV) and a simple model — a unit-economics read, not a forecast or financial advice.
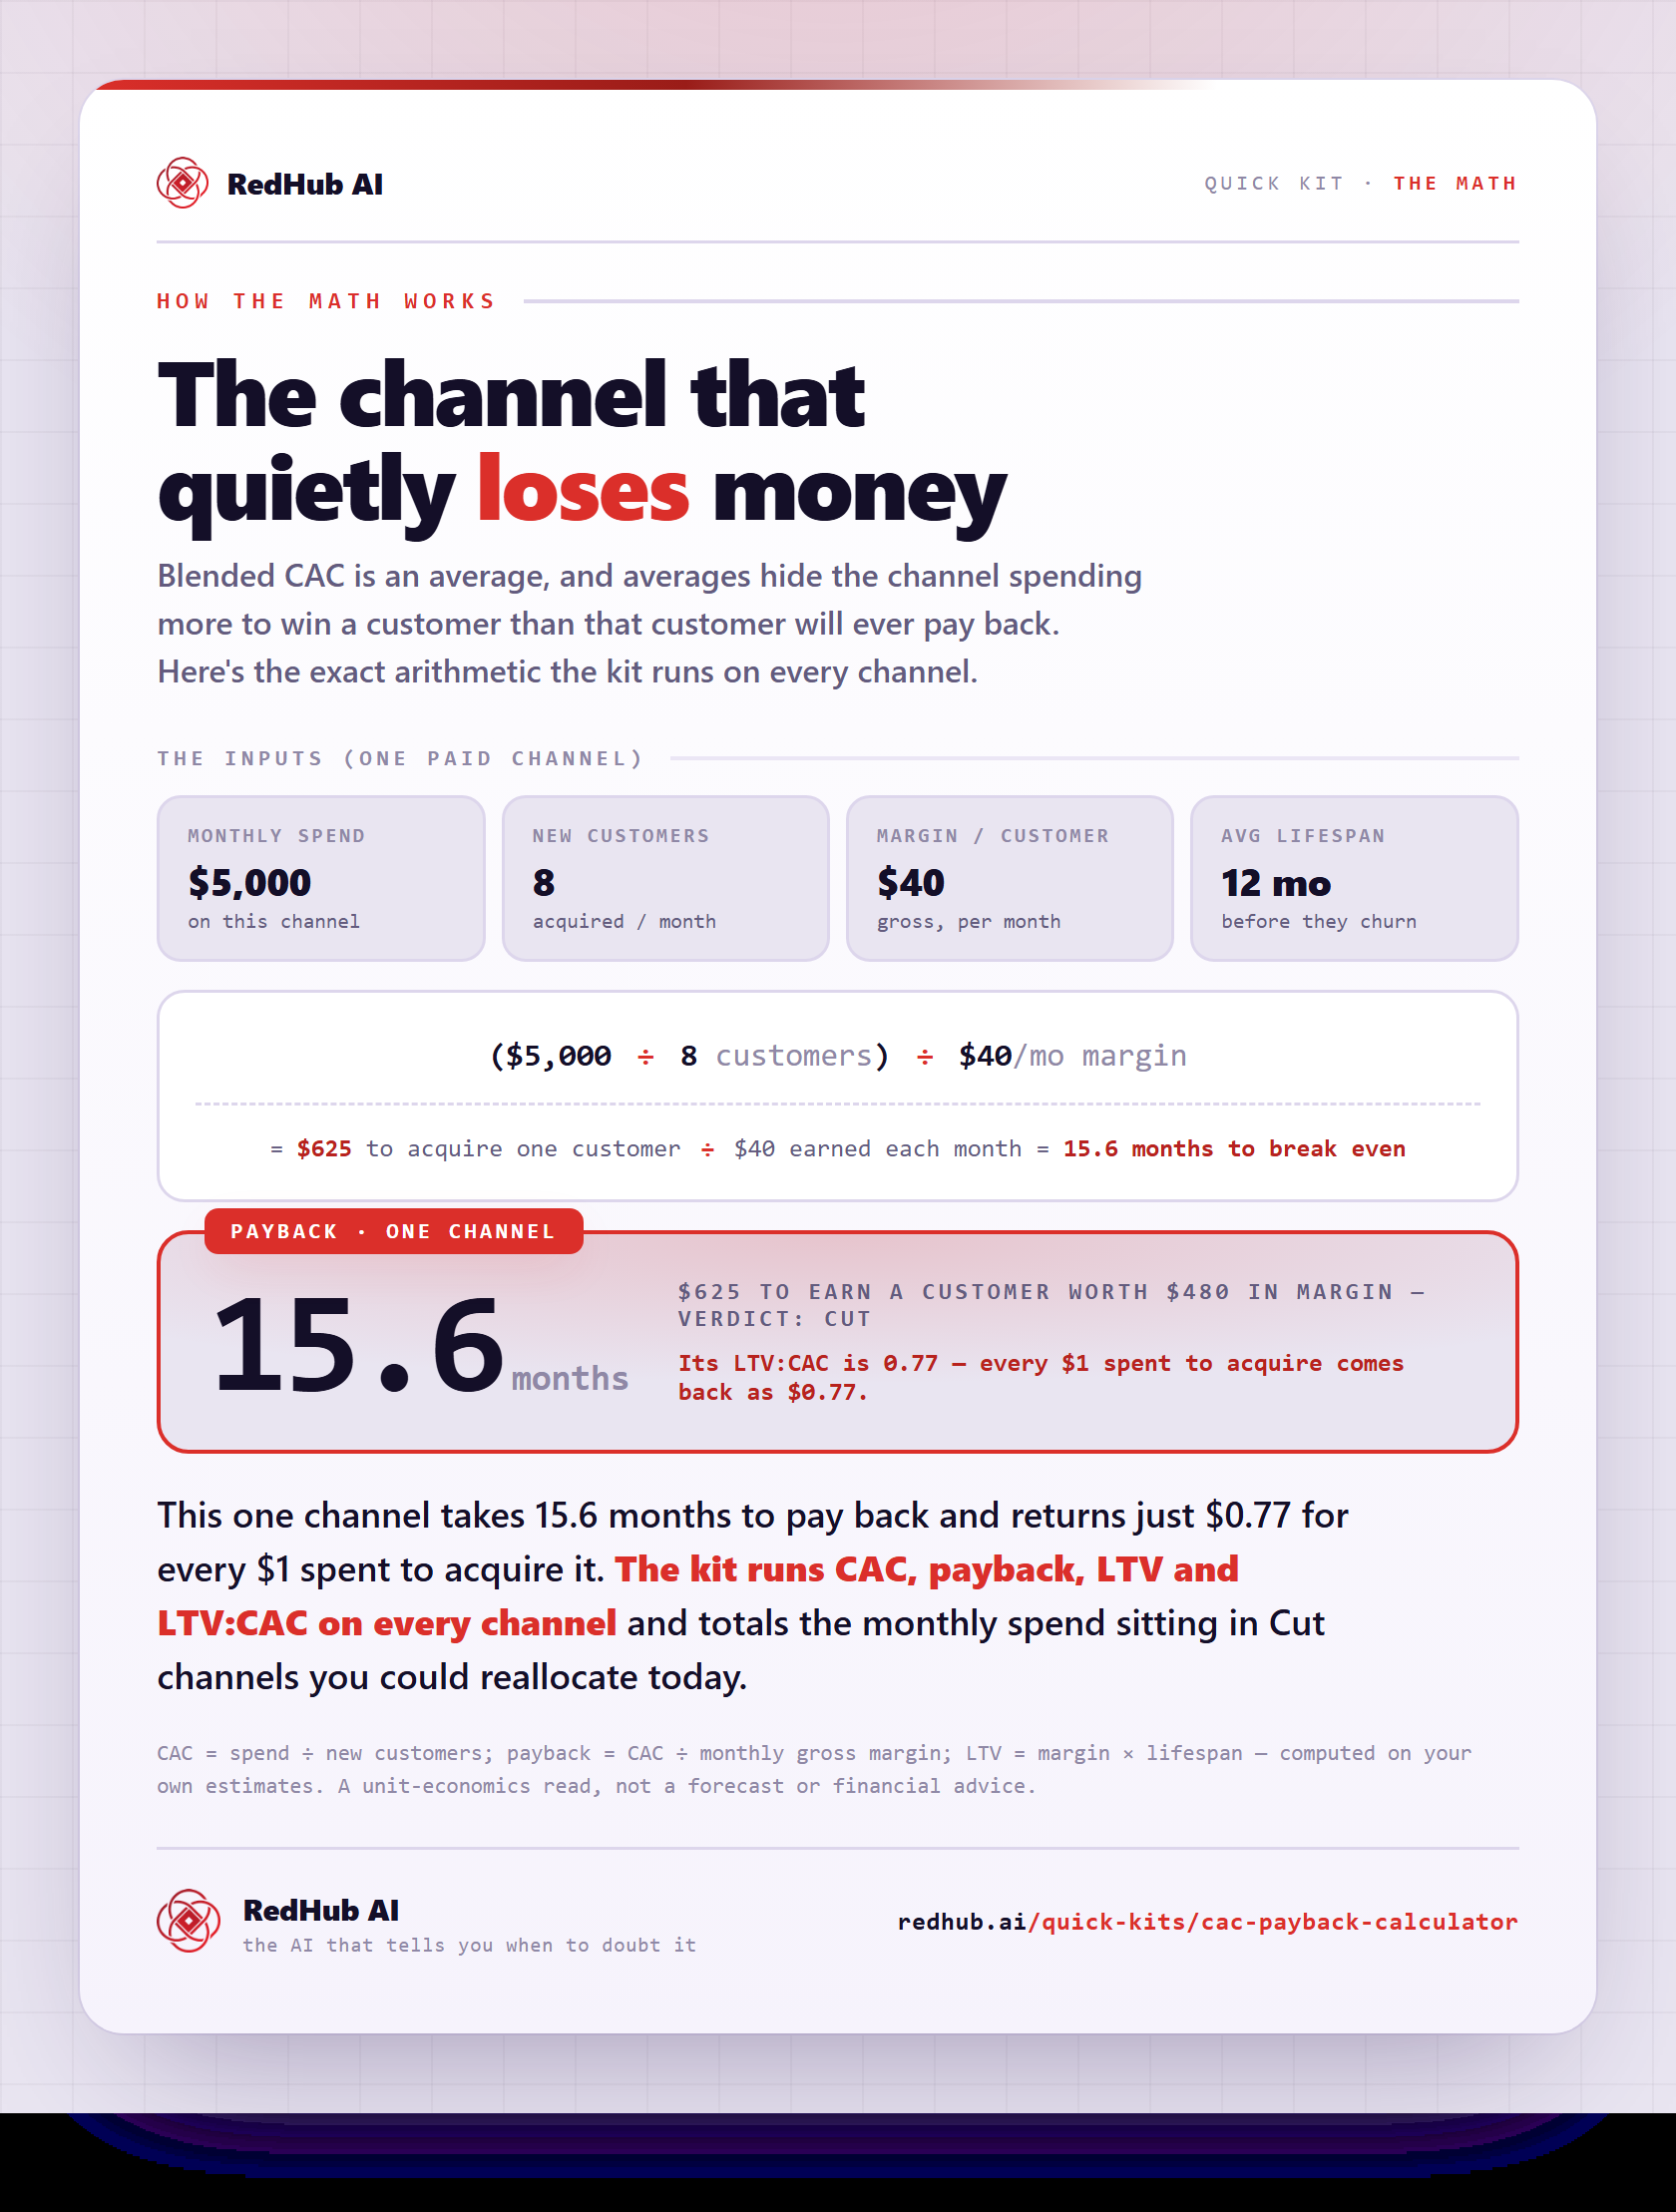
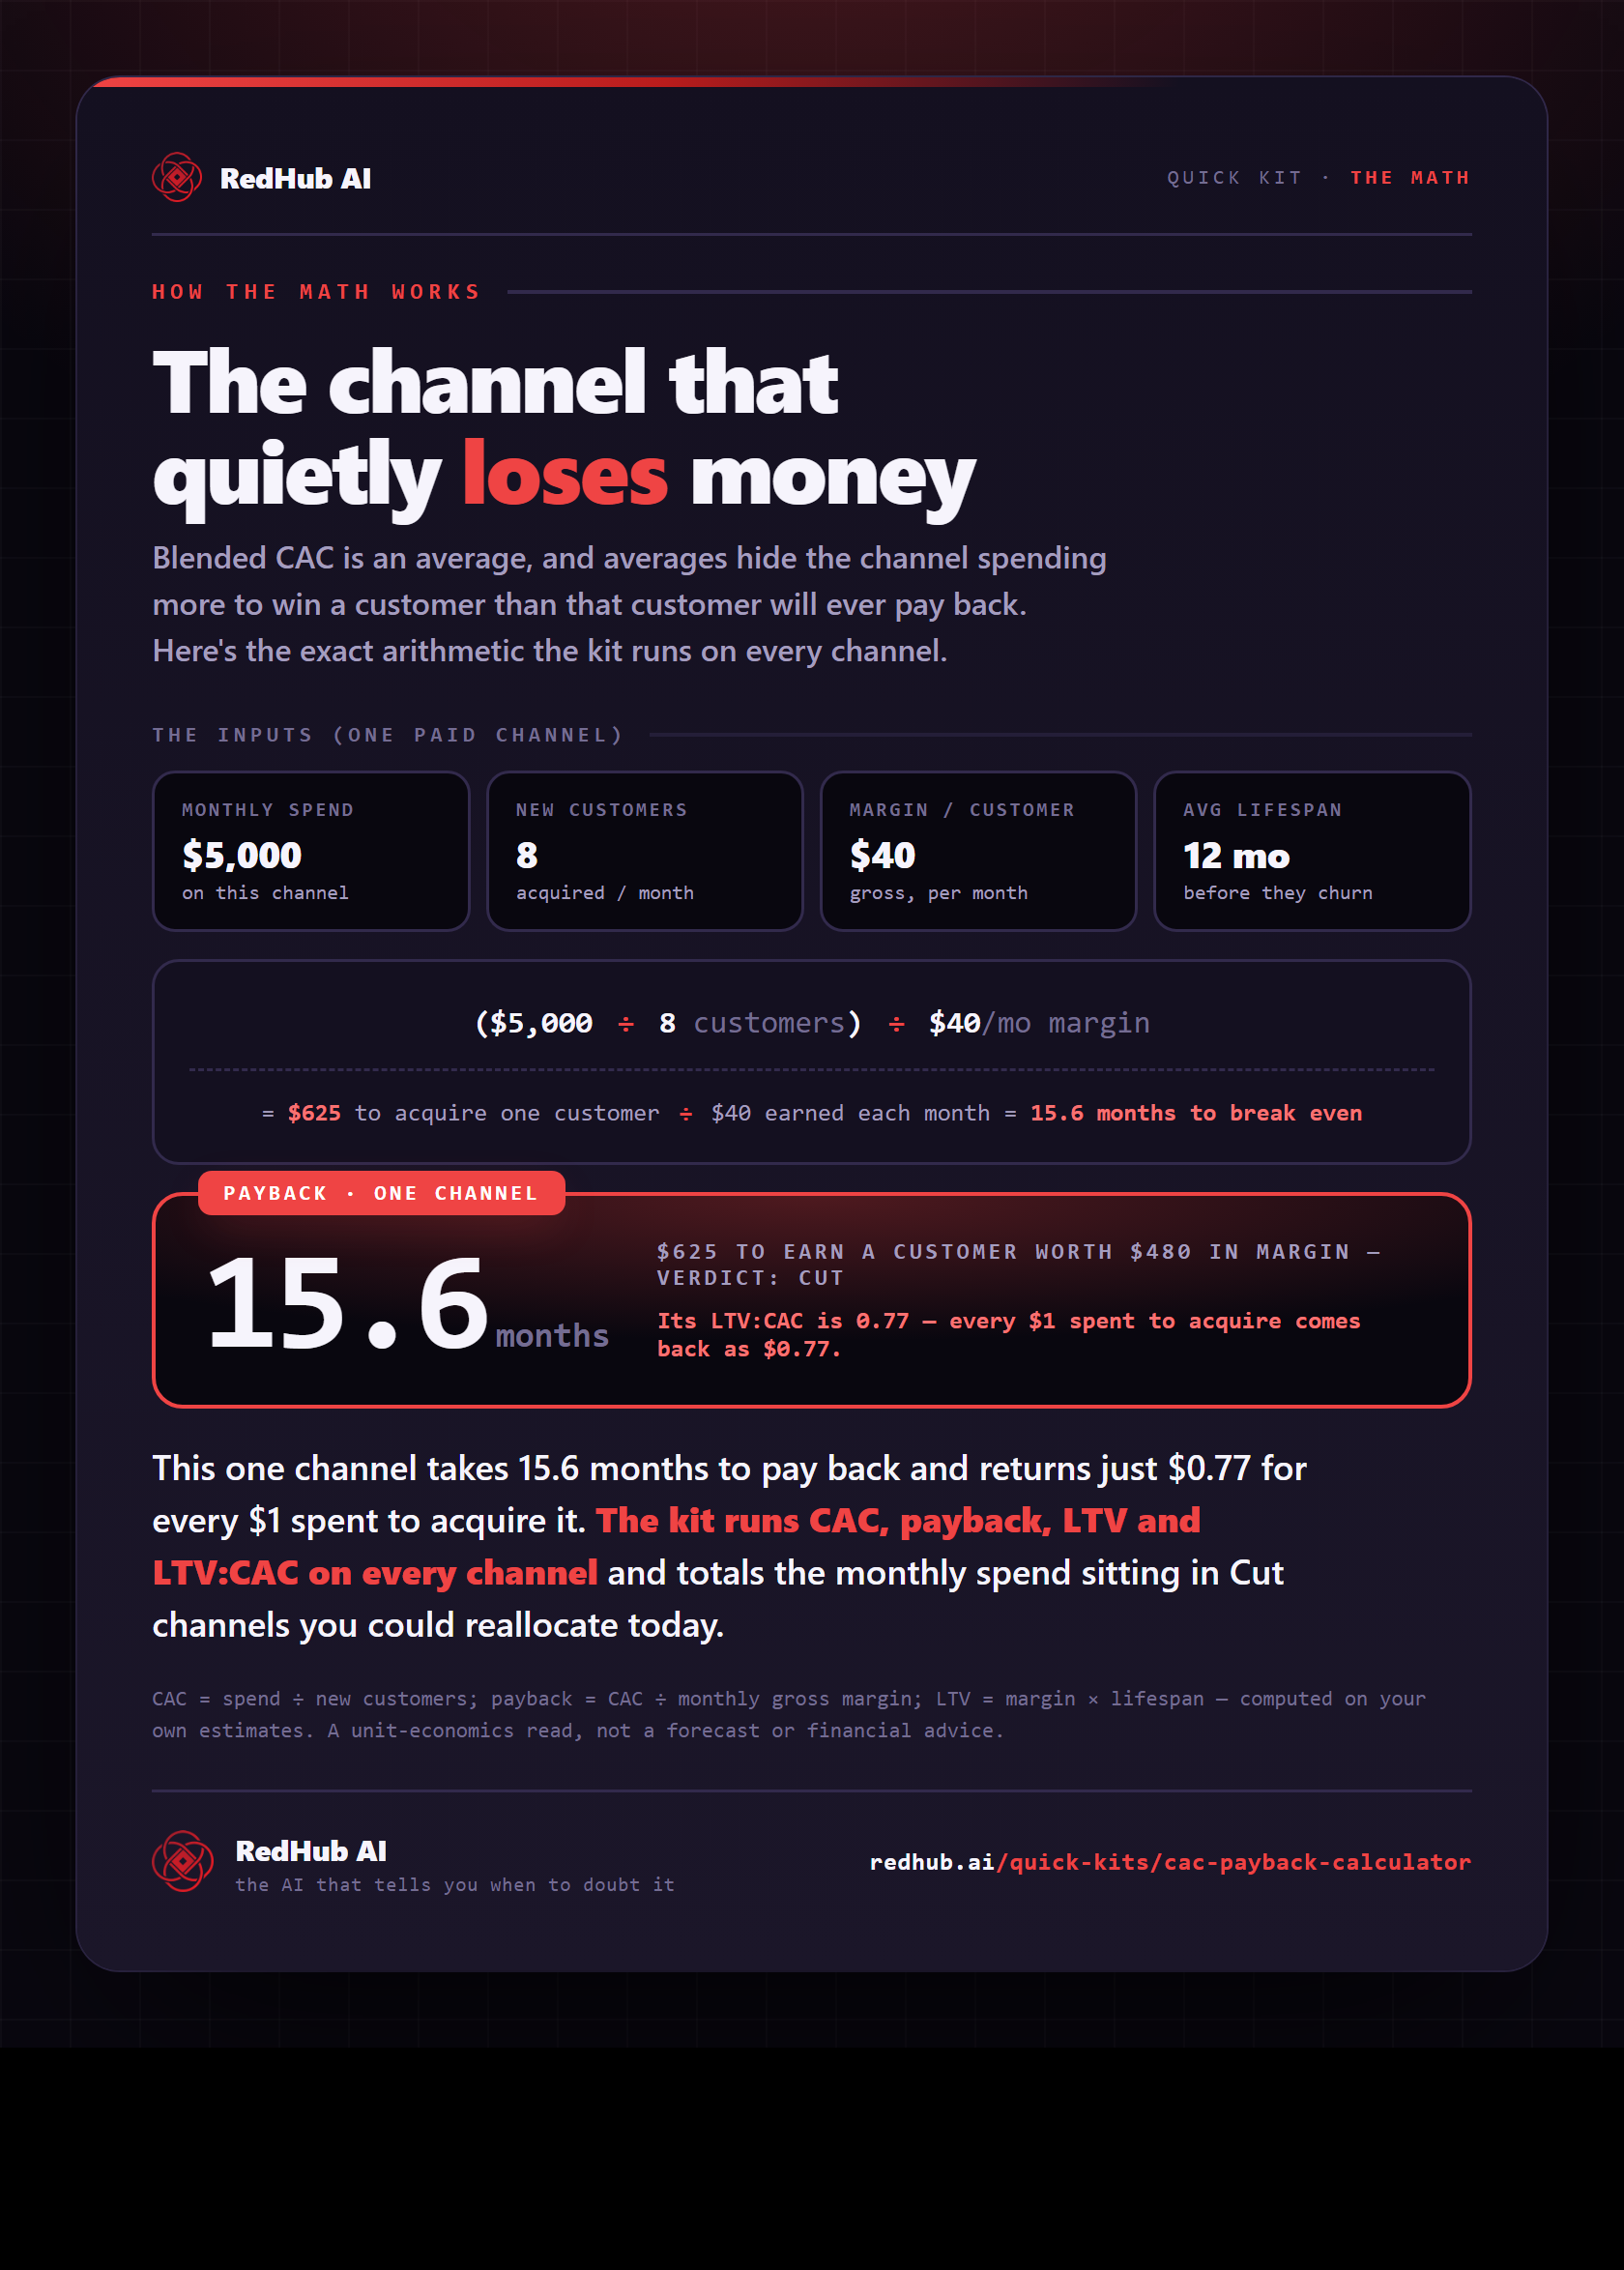
The math behind it, in one image
See per-channel CAC and payback: $5,000 spend ÷ 8 customers = $625 CAC, 15.6 months to pay back at $0.77 per $1 — a Cut.
See the full calculationWhy it's different
Payback, not just a ratio
Reports payback period
The metric your cash flow actually feels — a 16-month payback can 'work' on paper and still starve the business. Counted per channel.
Per channel, not blended
Breaks the average apart so the channels quietly losing money can't hide behind the ones that pay back fast.
A tool, not advice
It does the math on your own estimates of margin and lifespan. Gross-margin LTV, simple model — you make the call.
Payback period is the metric founders skip and CFOs live by. A 16-month payback works on paper and starves you in real life.
Who it's for
Clear about the lane. No inflated promises.
Built for you if…
- You spend on more than one acquisition channel and want to compare them properly
- You can estimate spend, new customers, monthly margin, and lifespan per channel
- You care about payback period, not just a CAC number
- You'd rather reallocate budget on evidence than on gut feel
Not for you if…
- You want a live integration that pulls spend and conversions automatically
- You can't separate spend or customers by channel even roughly
- You need discounted/NPV LTV and cohort modeling, not a fast read
Common Questions
The questions founders actually ask before they reallocate ad budget.
It's a one-time spreadsheet that breaks acquisition down by channel. You enter monthly spend, new customers, the gross margin one customer brings per month, and average lifespan; it computes CAC, payback period, LTV, and LTV:CAC for each channel, gives an invest / hold / cut verdict, and shows the blended CAC plus the monthly spend sitting in cut channels.
One .xlsx that opens in Microsoft Excel, Google Sheets, or Apple Numbers — no subscription, no login. It ships with a worked example so it makes sense immediately; overwrite it with your own channels.
Because it's an average, and averages hide the channels quietly losing money. In the built-in example, blended CAC is about $212 — but referral pays back in 0.6 months at 38:1 while influencer one-offs run 0.77:1 and lose money on every customer. The single blended number masks both.
Payback is the metric your cash flow actually feels. A 16-month payback can 'work' on paper and still starve a business of cash. The kit reports both — a channel needs healthy LTV:CAC and a reasonable payback to earn an Invest verdict.
Invest = LTV:CAC of 3 or better and payback within 12 months (pour more in). Hold = workable but not strong (keep steady, tighten CAC or lift retention before scaling). Cut = LTV:CAC under 1 or payback beyond 18 months (reallocate the spend). The 3:1 / 12-month bands are common rules of thumb, not guarantees.
It pairs with the Profit Leak Finder — one finds where money leaks out of the business, this decides where new acquisition money should go. When you outgrow a spreadsheet read, the AI Marketing Measurement Kit is the full attribution and reporting system.
Yes — a 30-day money-back guarantee. If it doesn't give you a clearer read on your acquisition channels, request a refund within 30 days.
CAC and payback are the scoreboard; the pipeline is the game. Pipeline Commander reads your CRM and grades pipeline health, coverage, and at-risk deals — the founder-grade Executive Suite cockpit. $249.
Get the kit
See which channels pay back this afternoon.
Instant download, yours to keep, 12 months of updates. Reallocating one losing channel usually covers it many times over.
- 3-tab .xlsx: Start Here, Channels, Acquisition Dashboard
- CAC / payback / LTV / LTV:CAC engine + invest / hold / cut verdict
- Blended CAC plus the spend sitting in Cut channels, totaled
- Works in Excel, Google Sheets, or Numbers · 30-day guarantee