Tool Gate · How it works
How the Operating-Cadence Engine gate works
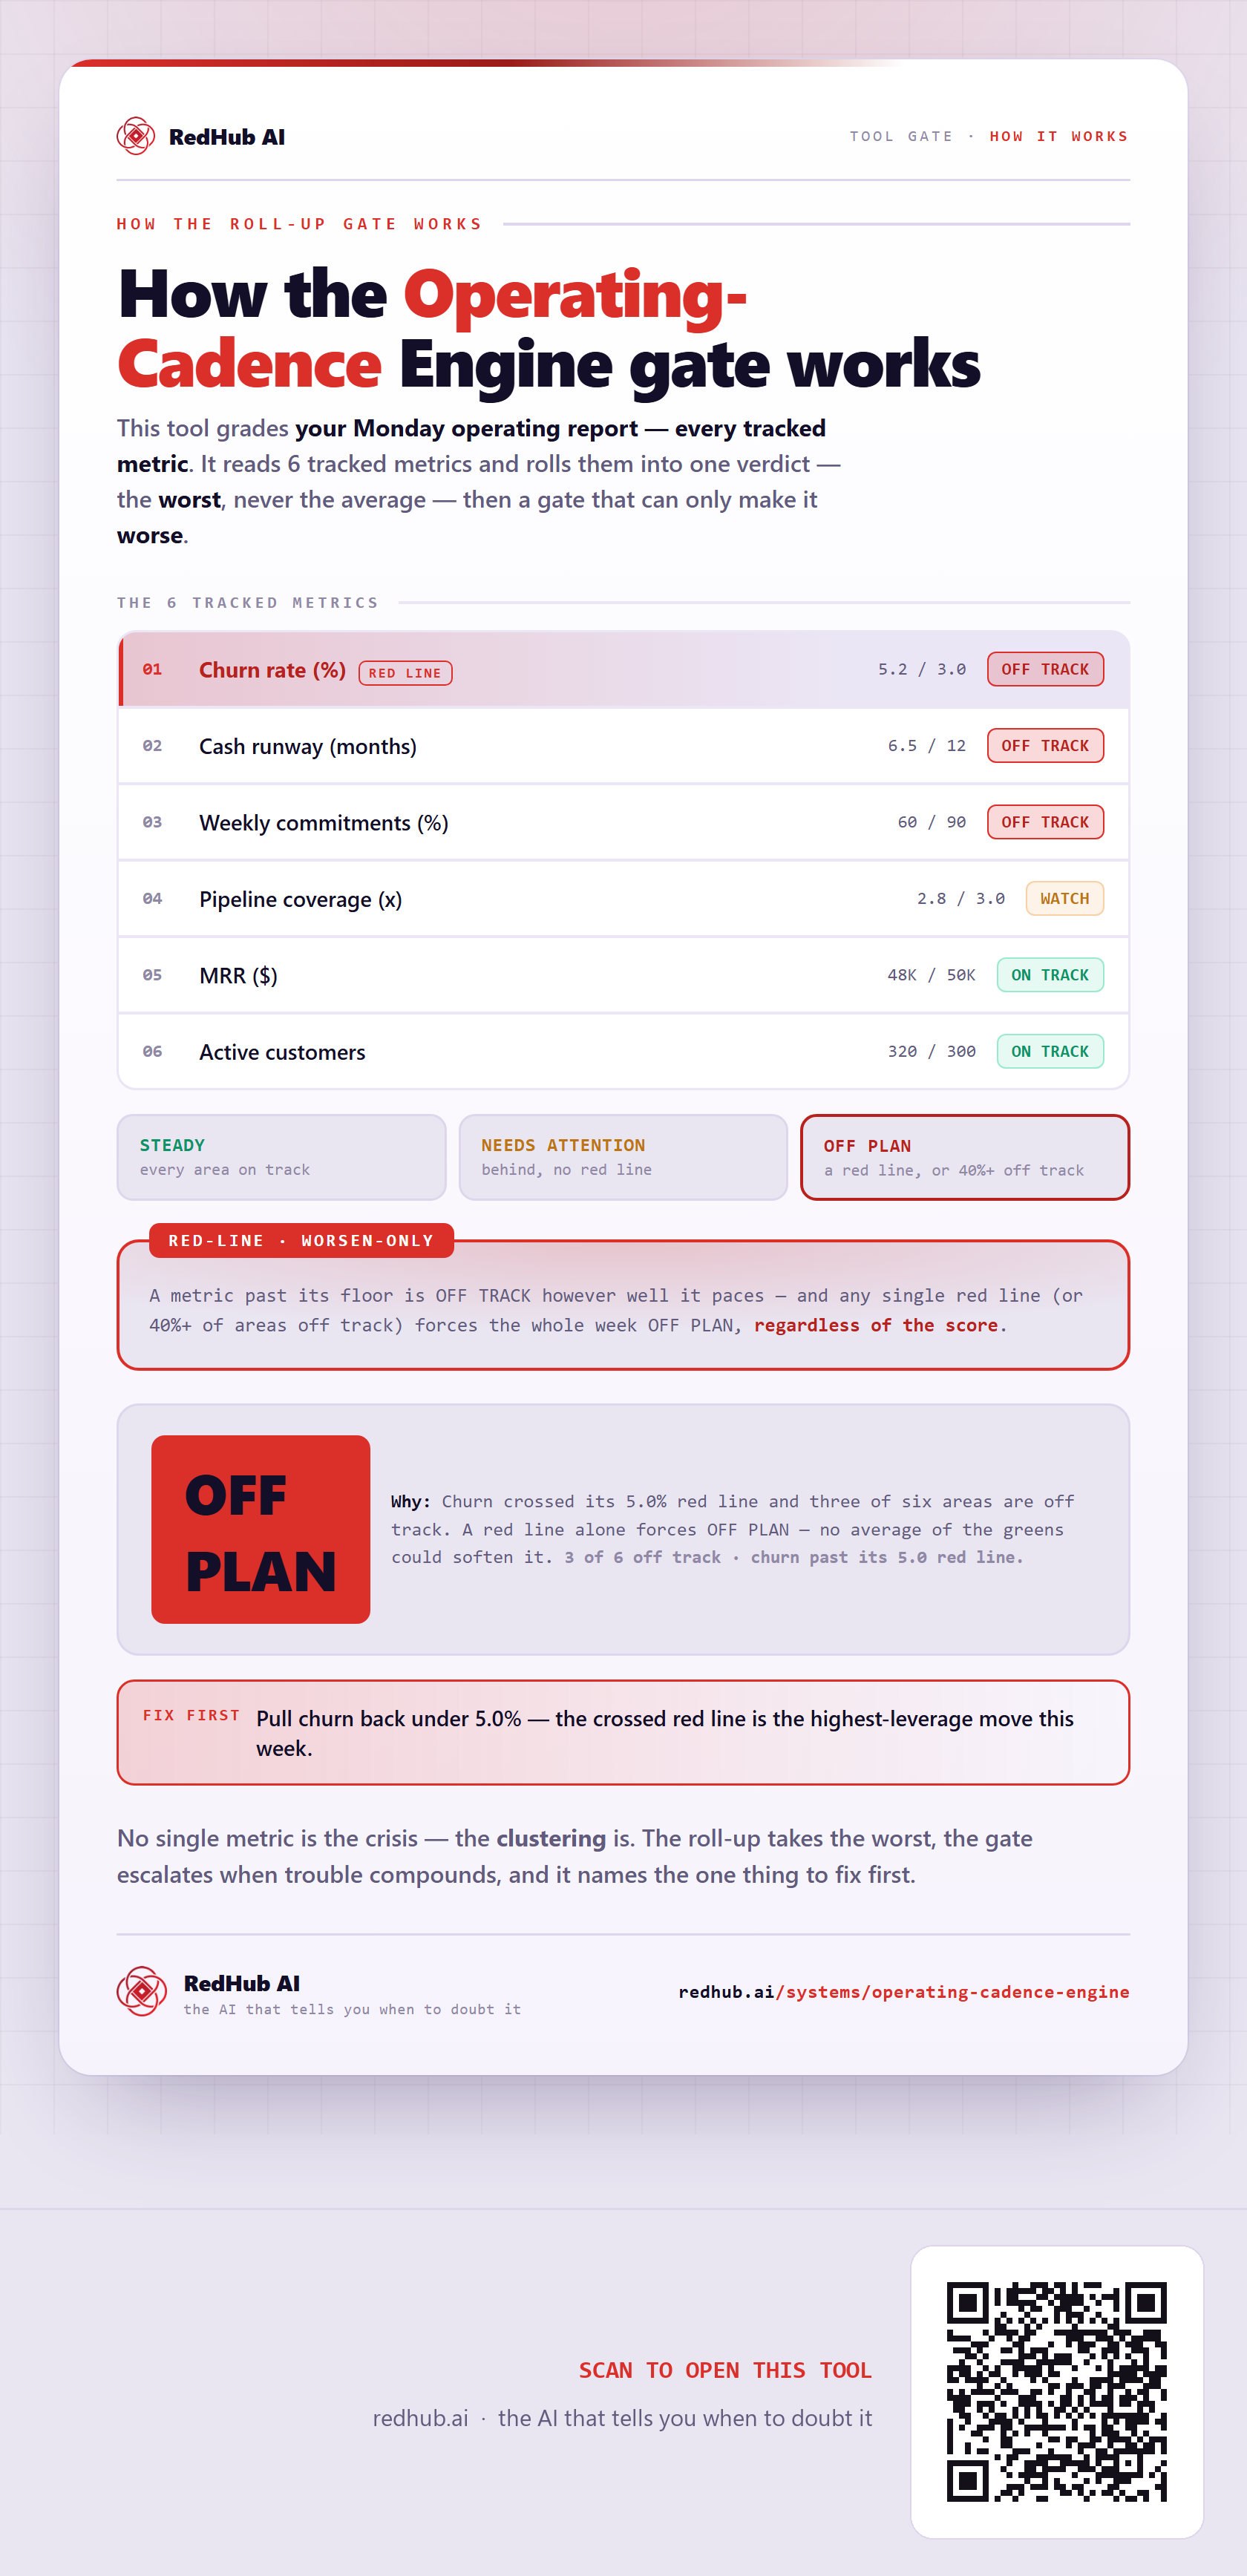
How the Operating-Cadence Engine rolls six tracked metrics into one weekly verdict: any metric past its red line is OFF TRACK however it paces, and a single red line (or 40%+ off track) forces the week OFF PLAN — which is how a report with four healthy signals still reads OFF PLAN.
How the gate works
This tool grades your Monday operating report — every tracked metric. It reads 6 tracked metrics and rolls them into one verdict — the worst, never the average — and then a gate that can only make it worse.
The 6 tracked metrics
| Metric | Verdict |
|---|---|
| Churn rate (%)red line | OFF TRACK5.2 / 3.0 |
| Cash runway (months) | OFF TRACK6.5 / 12 |
| Weekly commitments (%) | OFF TRACK60 / 90 |
| Pipeline coverage (x) | WATCH2.8 / 3.0 |
| MRR ($) | ON TRACK48K / 50K |
| Active customers | ON TRACK320 / 300 |
The verdict bands
A metric past its floor is OFF TRACK however well it paces — and any single red line (or 40%+ of areas off track) forces the whole week OFF PLAN, regardless of the score.
In the worked sample it reads OFF PLAN — Churn crossed its 5.0% red line and three of six areas are off track. A red line alone forces OFF PLAN — no average of the greens could soften it. Marked fix first on this sample: Pull churn back under 5.0% — the crossed red line is the highest-leverage move this week..
Common questions
Can every metric look survivable on the How the Operating-Cadence Engine gate works and the company still read OFF PLAN?
Yes. The roll-up takes the worst of 6 tracked metrics — never the average — then a worsen-only gate, the Red-line gate, escalates when trouble clusters. In the worked sample it reads OFF PLAN because churn crossed its 5.0% red line and three of six areas are off track. A red line alone forces OFF PLAN — no average of the greens could soften it.
What is a worsen-only gate?
A dispositive rule that can only lower a verdict, never raise it. One fatal flaw overrides an otherwise-set of survivable lines, because a single disqualifying gap shouldn't hide behind an average of the healthy ones. Where something is short, the fix-first row names it — here, "Pull churn back under 5.0% — the crossed red line is the highest-leverage move this week.".
Embed this diagram
Free to share and embed with attribution (CC BY 4.0) — keep the link to redhub.ai.
Interactive — renders the live diagram
<iframe src="https://redhub.ai/visuals/tool/operating-cadence-engine.html" title="How the Operating-Cadence Engine gate works — RedHub AI" width="760" height="1600" loading="lazy" style="border:0;width:100%;max-width:760px"></iframe>
<p style="font:14px/1.5 system-ui,sans-serif"><a href="https://redhub.ai/visuals/tool/operating-cadence-engine">How the Operating-Cadence Engine gate works</a> — by <a href="https://redhub.ai">RedHub AI</a>, the AI that tells you when to doubt it.</p>
Image + link — a static picture for any blog
<a href="https://redhub.ai/visuals/tool/operating-cadence-engine"><img src="https://redhub.ai/visuals/tool/operating-cadence-engine-share.png" alt="Diagram of the Operating-Cadence Engine: six tracked metrics rolled up, a red-line gate, and a weekly verdict of OFF PLAN driven by a crossed churn red line." width="760" loading="lazy" style="max-width:100%;height:auto;border-radius:16px"></a>
<p style="font:14px/1.5 system-ui,sans-serif"><a href="https://redhub.ai">RedHub AI</a> — the AI that tells you when to doubt it.</p>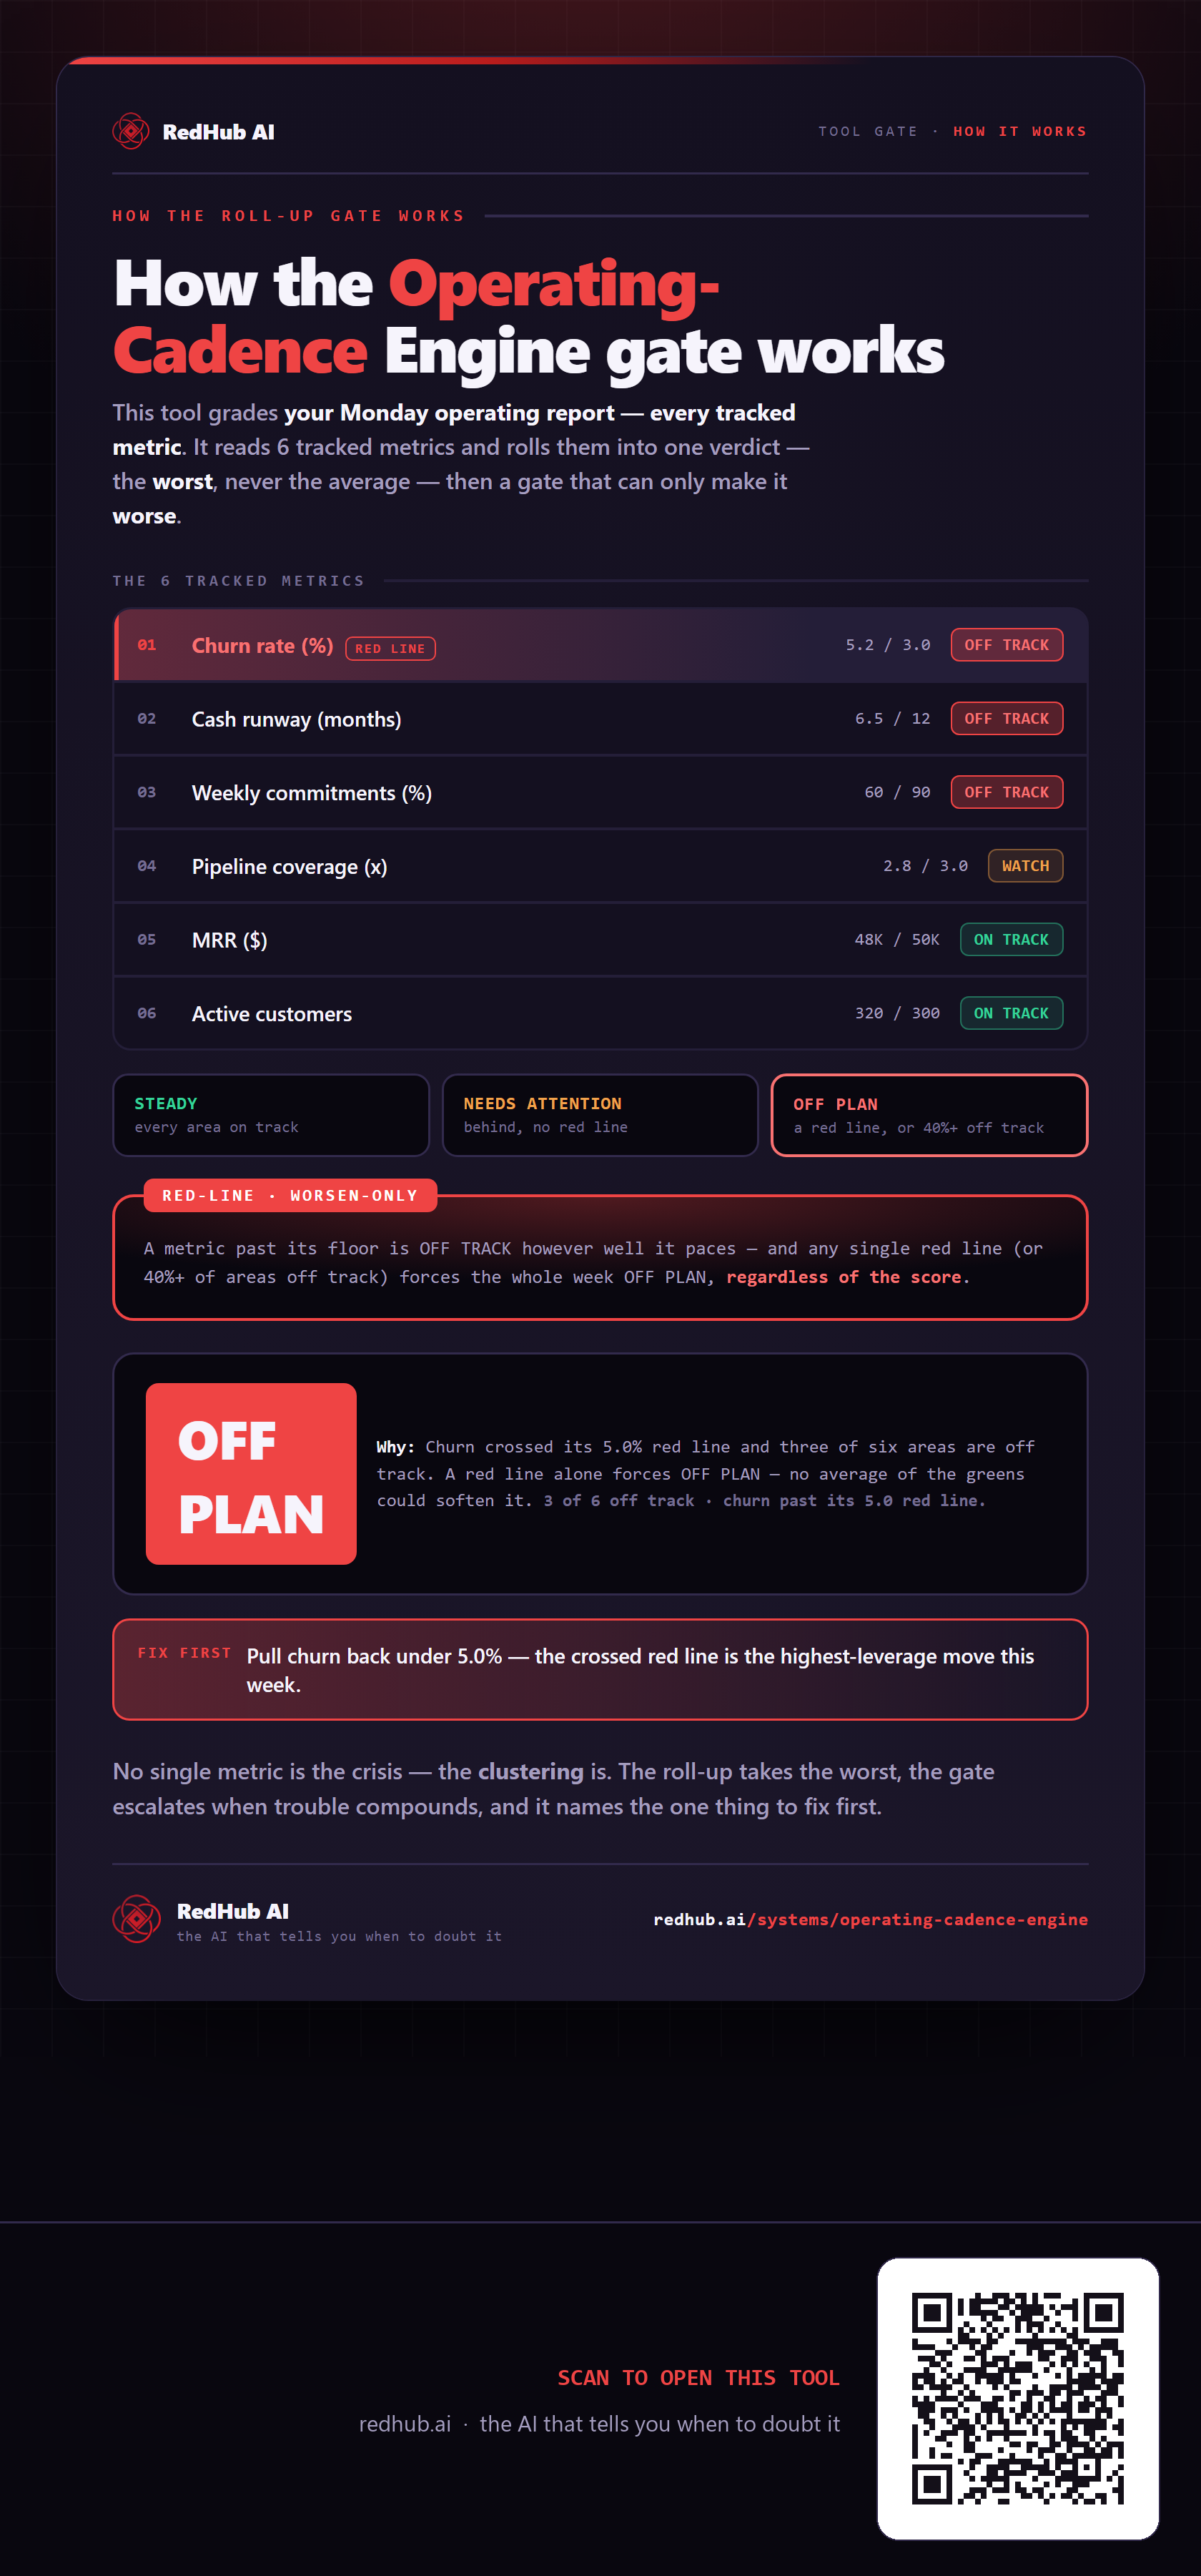
This is how Operating-Cadence Engine works. More diagrams in the Visual Field Guide.