Tool Gate · How it works
How the Lead Source ROI Scorecard gate works
How the Lead Source ROI Scorecard grades a paid lead source: a grid of ROAS (under 1x, 1x to under 3x, 3x or more) against qualified rate (20% floor), with no score and no weights. Cold email list returns 0.5x on a 3% qualified rate, under both bars, so it reads CUT; Facebook Ads returns 4.0x, over the 3x scale bar, but only 8% of its raw leads qualify against a 20% floor, so it reads FIX instead of SCALE.
How the gate works
This tool grades each paid lead source on return and lead quality before you scale it. Each of the 5 sources gets its own verdict from where its own numbers land on a grid of ROAS against qualified rate; no verdict is drawn from an average or a roll-up, and the set gets none. The fit gate reads each source: with ROAS at 3x or more and under 20% of its raw leads qualifying, the source reads FIX instead of SCALE.
The 5 sources
| Source | Verdict |
|---|---|
| Referral | SCALEROAS 13.5x · 75% qualified |
| Google Ads | SCALEROAS 4.1x · 35% qualified |
| Facebook Adsgated | FIXROAS 4.0x · 8% qualified |
| Cold email list | CUTROAS 0.5x · 3% qualified |
| LinkedIn Ads | FIXROAS 0.6x · 60% qualified |
Where a source lands
| qualified rate / ROAS | ROAS under 1x | ROAS 1x to under 3x | ROAS 3x or more |
|---|---|---|---|
| Qualified under 20% | CUTCold email list | FIX | FIXFacebook Ads |
| Qualified 20% or more | FIXLinkedIn Ads | FIX | SCALEReferral, Google Ads |
1x, 3x and 20% are the workbook's default settings; you change all three on the Source Scorecard tab. A source exactly on a line counts as at or above it.
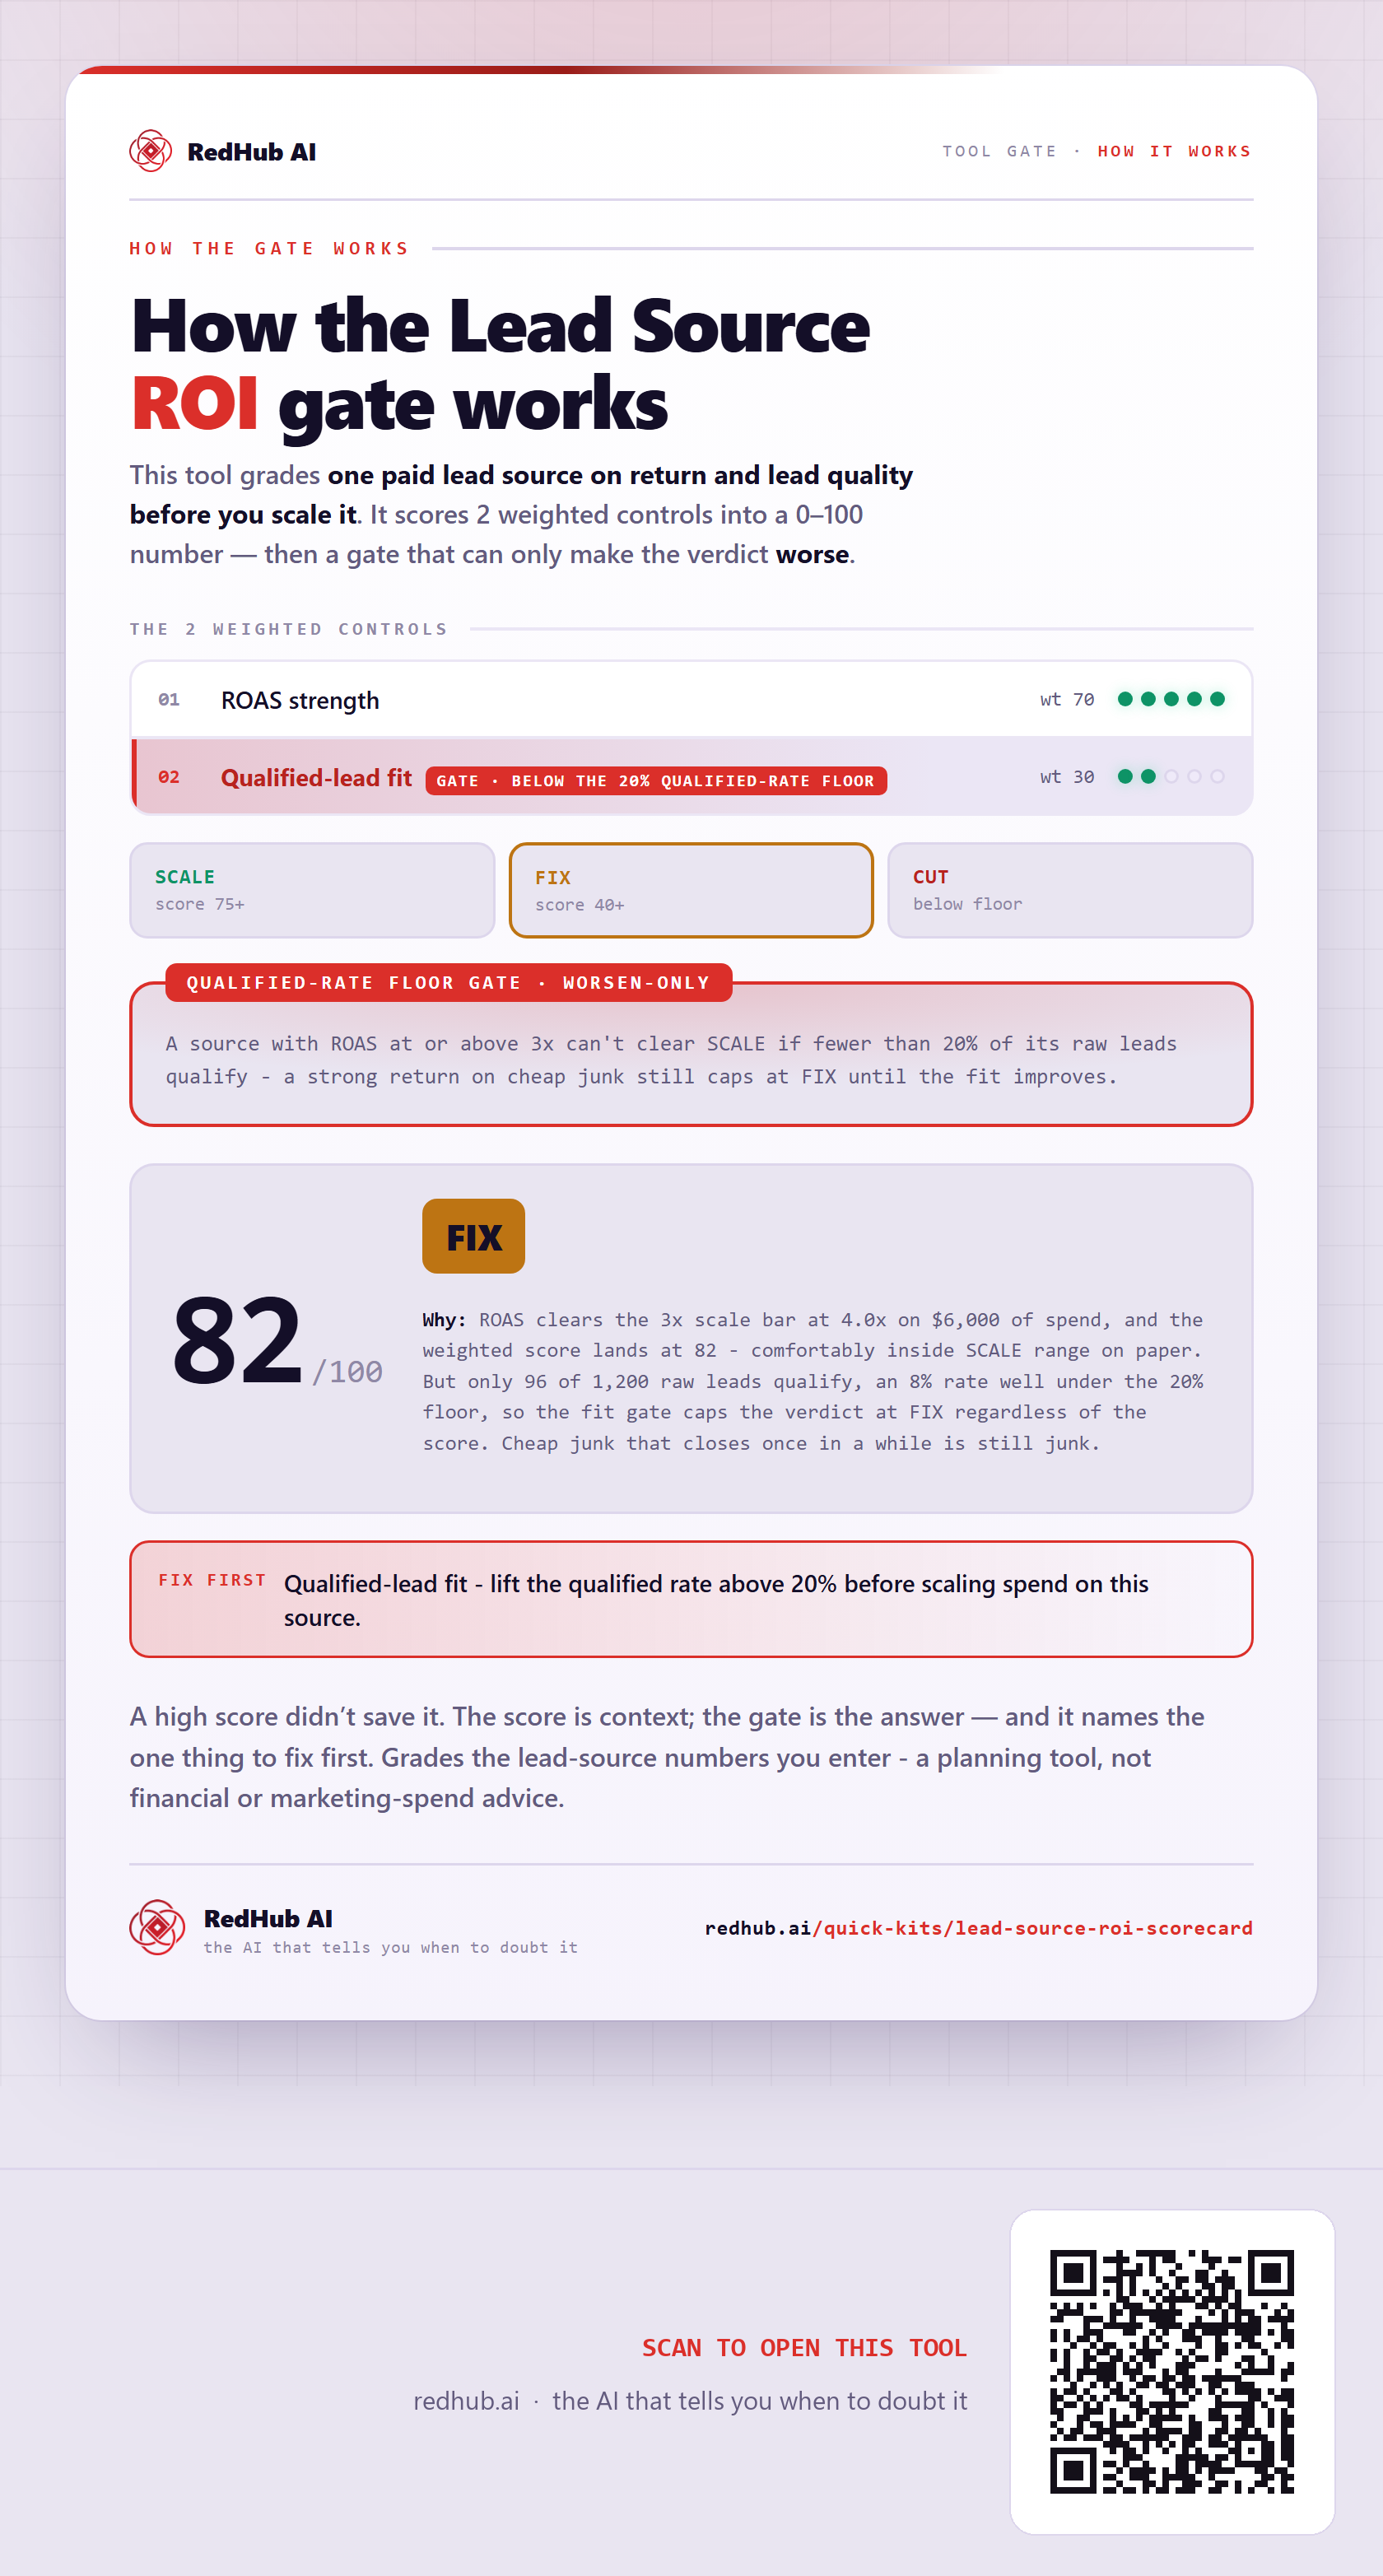
A source with ROAS at or above 3x can't read SCALE if fewer than 20% of its raw leads qualify: a strong return on cheap junk reads FIX until the fit improves.
In the worked sample, Facebook Ads, one source of the 5, reads FIX — Facebook Ads returns 4.0x on $6,000 of spend, over the 3x scale bar, but only 96 of its 1,200 raw leads qualify. That 8% rate is under the 20% floor, so the fit gate holds it at FIX instead of SCALE. Dashboard: $3,000 of spend to reallocate from CUT sources and $11,000 in FIX sources, with the verdicts counted 2 SCALE / 2 FIX / 1 CUT. It names no source to fix first.
Common questions
Can a lead source with a strong ROAS still miss SCALE on the Lead Source ROI Scorecard?
Yes. SCALE needs both a ROAS at 3x or more and a qualified rate at 20% or more. In the workbook's sample, Facebook Ads returns 4.0x on $6,000 of spend, but only 96 of its 1,200 raw leads qualify, an 8% rate under the 20% floor, so it reads FIX.
Does the Lead Source ROI Scorecard give one verdict for all the sources?
No. Each source gets its own SCALE, FIX or CUT verdict from its own ROAS and qualified rate. The Dashboard does report a blended ROAS and a blended cost per qualified lead across all sources, and it counts the verdicts and totals the spend sitting in CUT and FIX sources, but no verdict is drawn from the blended figures and there is no single portfolio verdict.
Grades the lead-source numbers you enter - a planning tool, not financial or marketing-spend advice.
Embed this diagram
Free to share and embed with attribution (CC BY 4.0) — keep the link to redhub.ai.
Interactive — renders the live diagram
<iframe src="https://redhub.ai/visuals/tool/lead-source-roi-scorecard.html" title="How the Lead Source ROI Scorecard gate works — RedHub AI" width="760" height="1760" loading="lazy" style="border:0;width:100%;max-width:760px"></iframe>
<p style="font:14px/1.5 system-ui,sans-serif"><a href="https://redhub.ai/visuals/tool/lead-source-roi-scorecard">How the Lead Source ROI Scorecard gate works</a> — by <a href="https://redhub.ai">RedHub AI</a>, the AI that tells you when to doubt it.</p>
Image + link — a static picture for any blog
<a href="https://redhub.ai/visuals/tool/lead-source-roi-scorecard"><img src="https://redhub.ai/visuals/tool/lead-source-roi-scorecard-share.png" alt="Diagram of the Lead Source ROI Scorecard: five lead sources with ROAS and qualified rate, each read SCALE, FIX or CUT on a ROAS-by-qualified-rate grid; no verdict uses the Dashboard's blended figures." width="760" loading="lazy" style="max-width:100%;height:auto;border-radius:16px"></a>
<p style="font:14px/1.5 system-ui,sans-serif"><a href="https://redhub.ai">RedHub AI</a> — the AI that tells you when to doubt it.</p>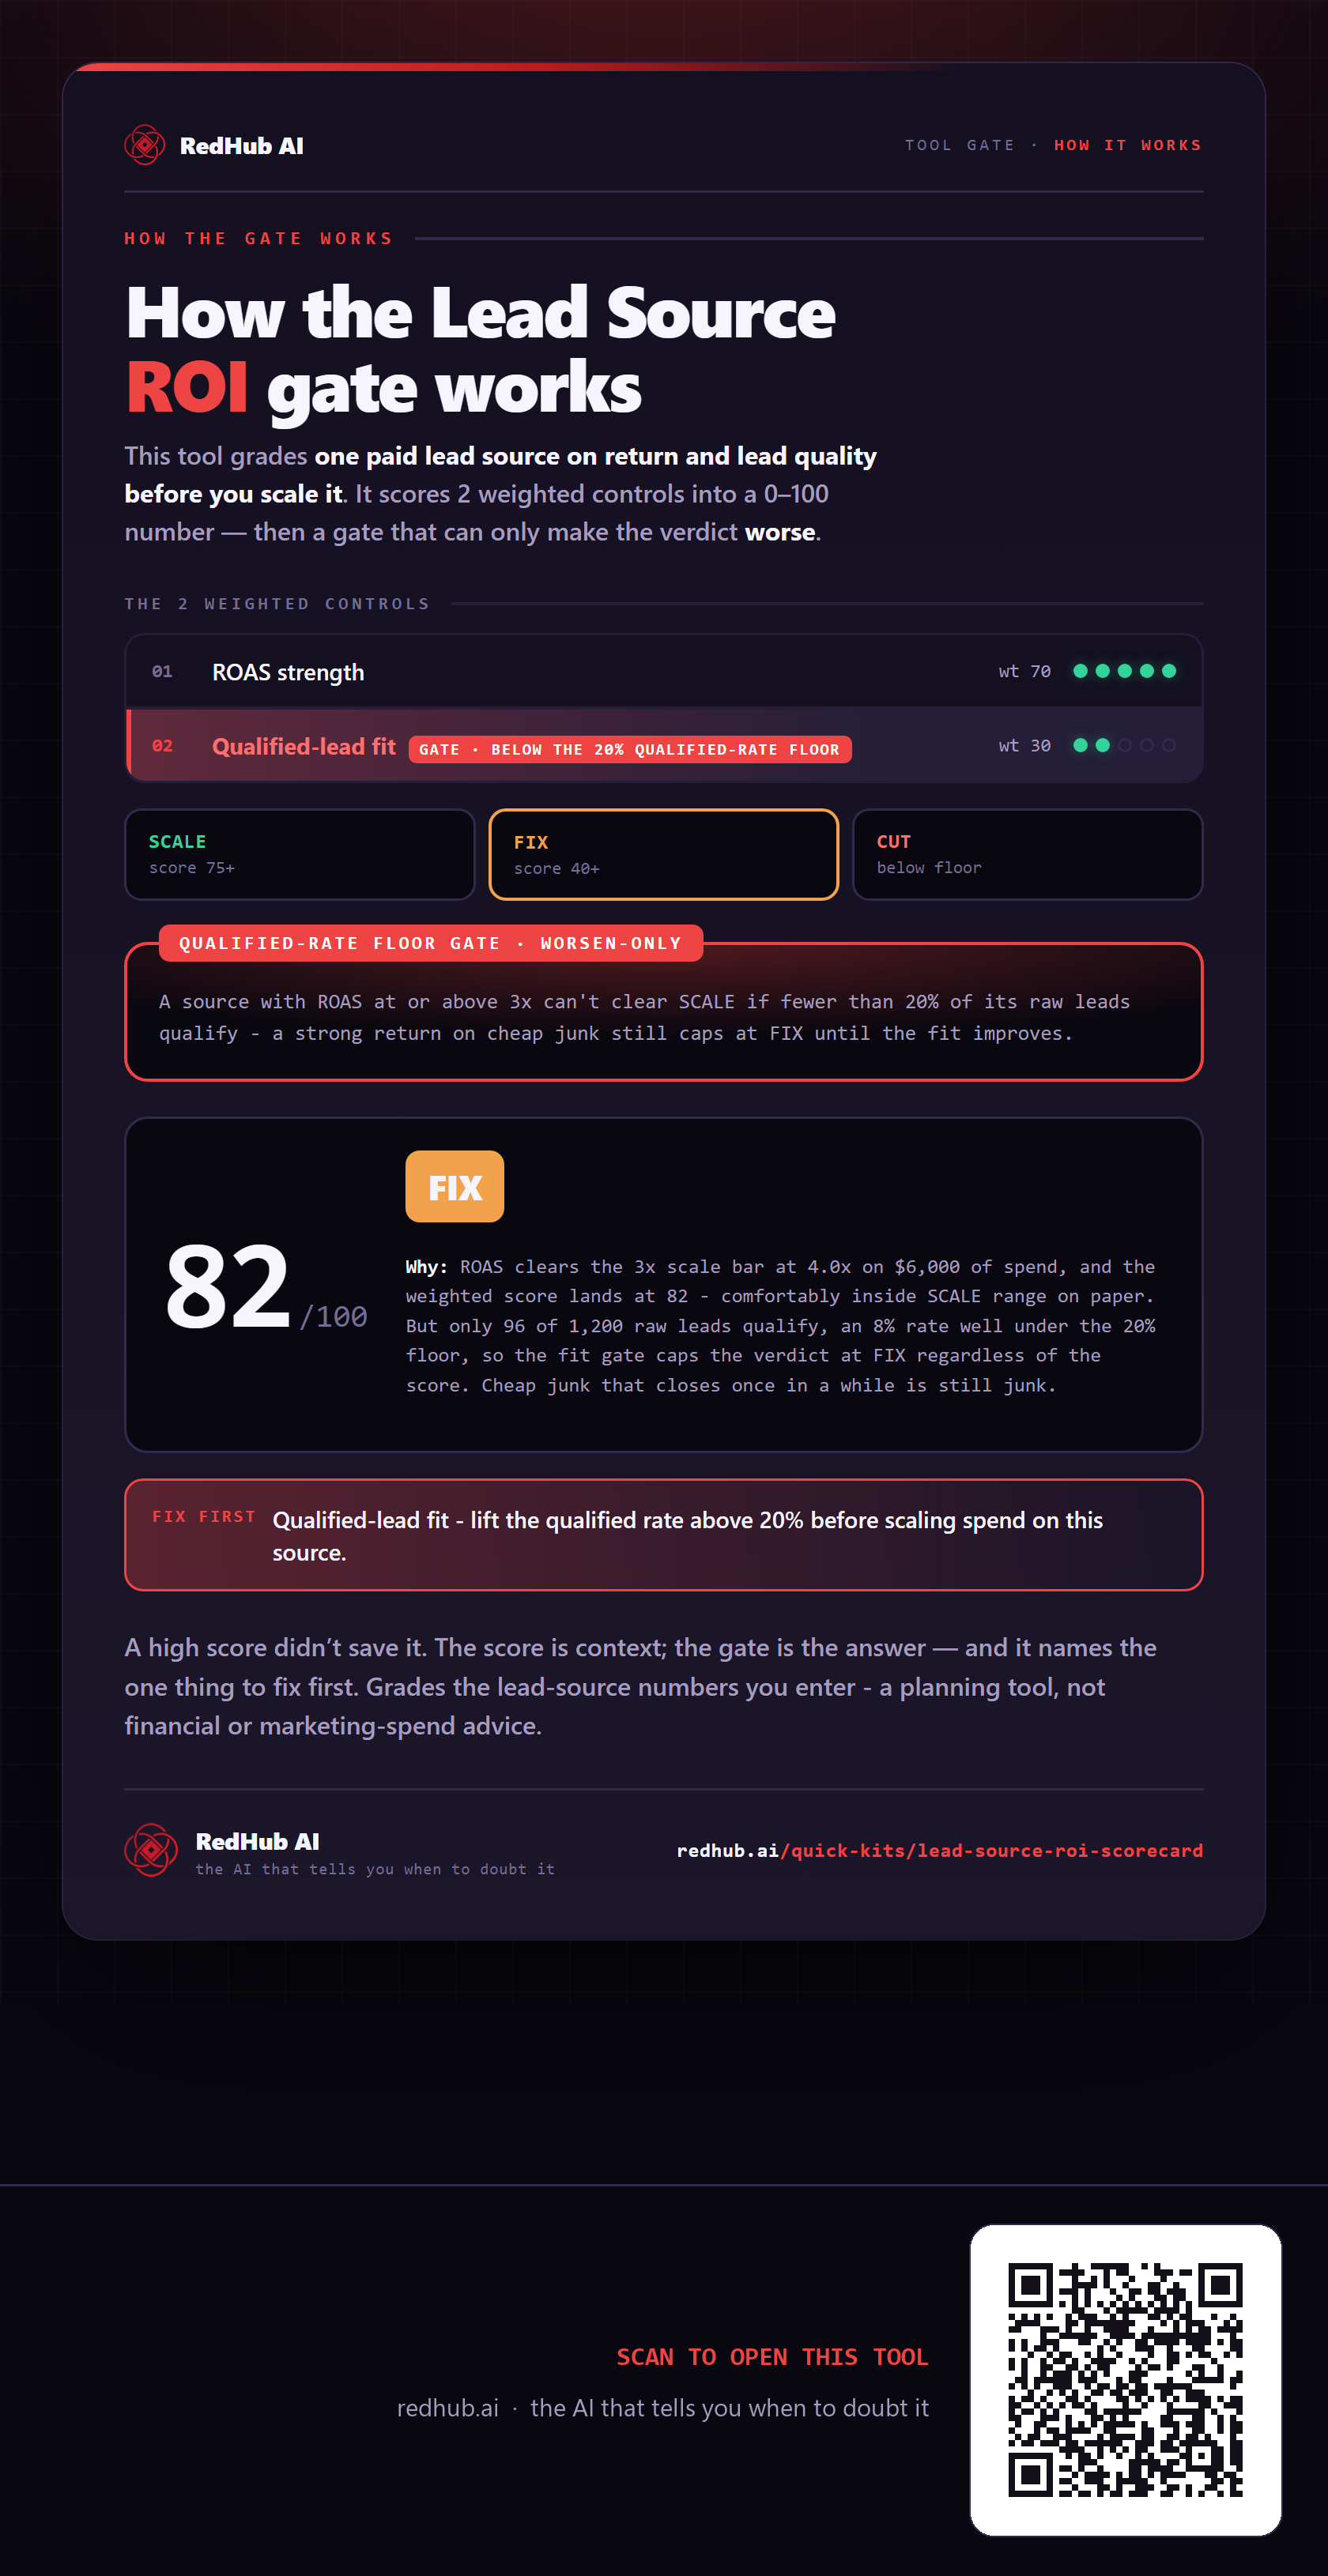
This is how Lead Source ROI Scorecard works. More diagrams in the Visual Field Guide.