Tool Gate · How it works
How the Cost-of-Poor-Quality Ledger gate works
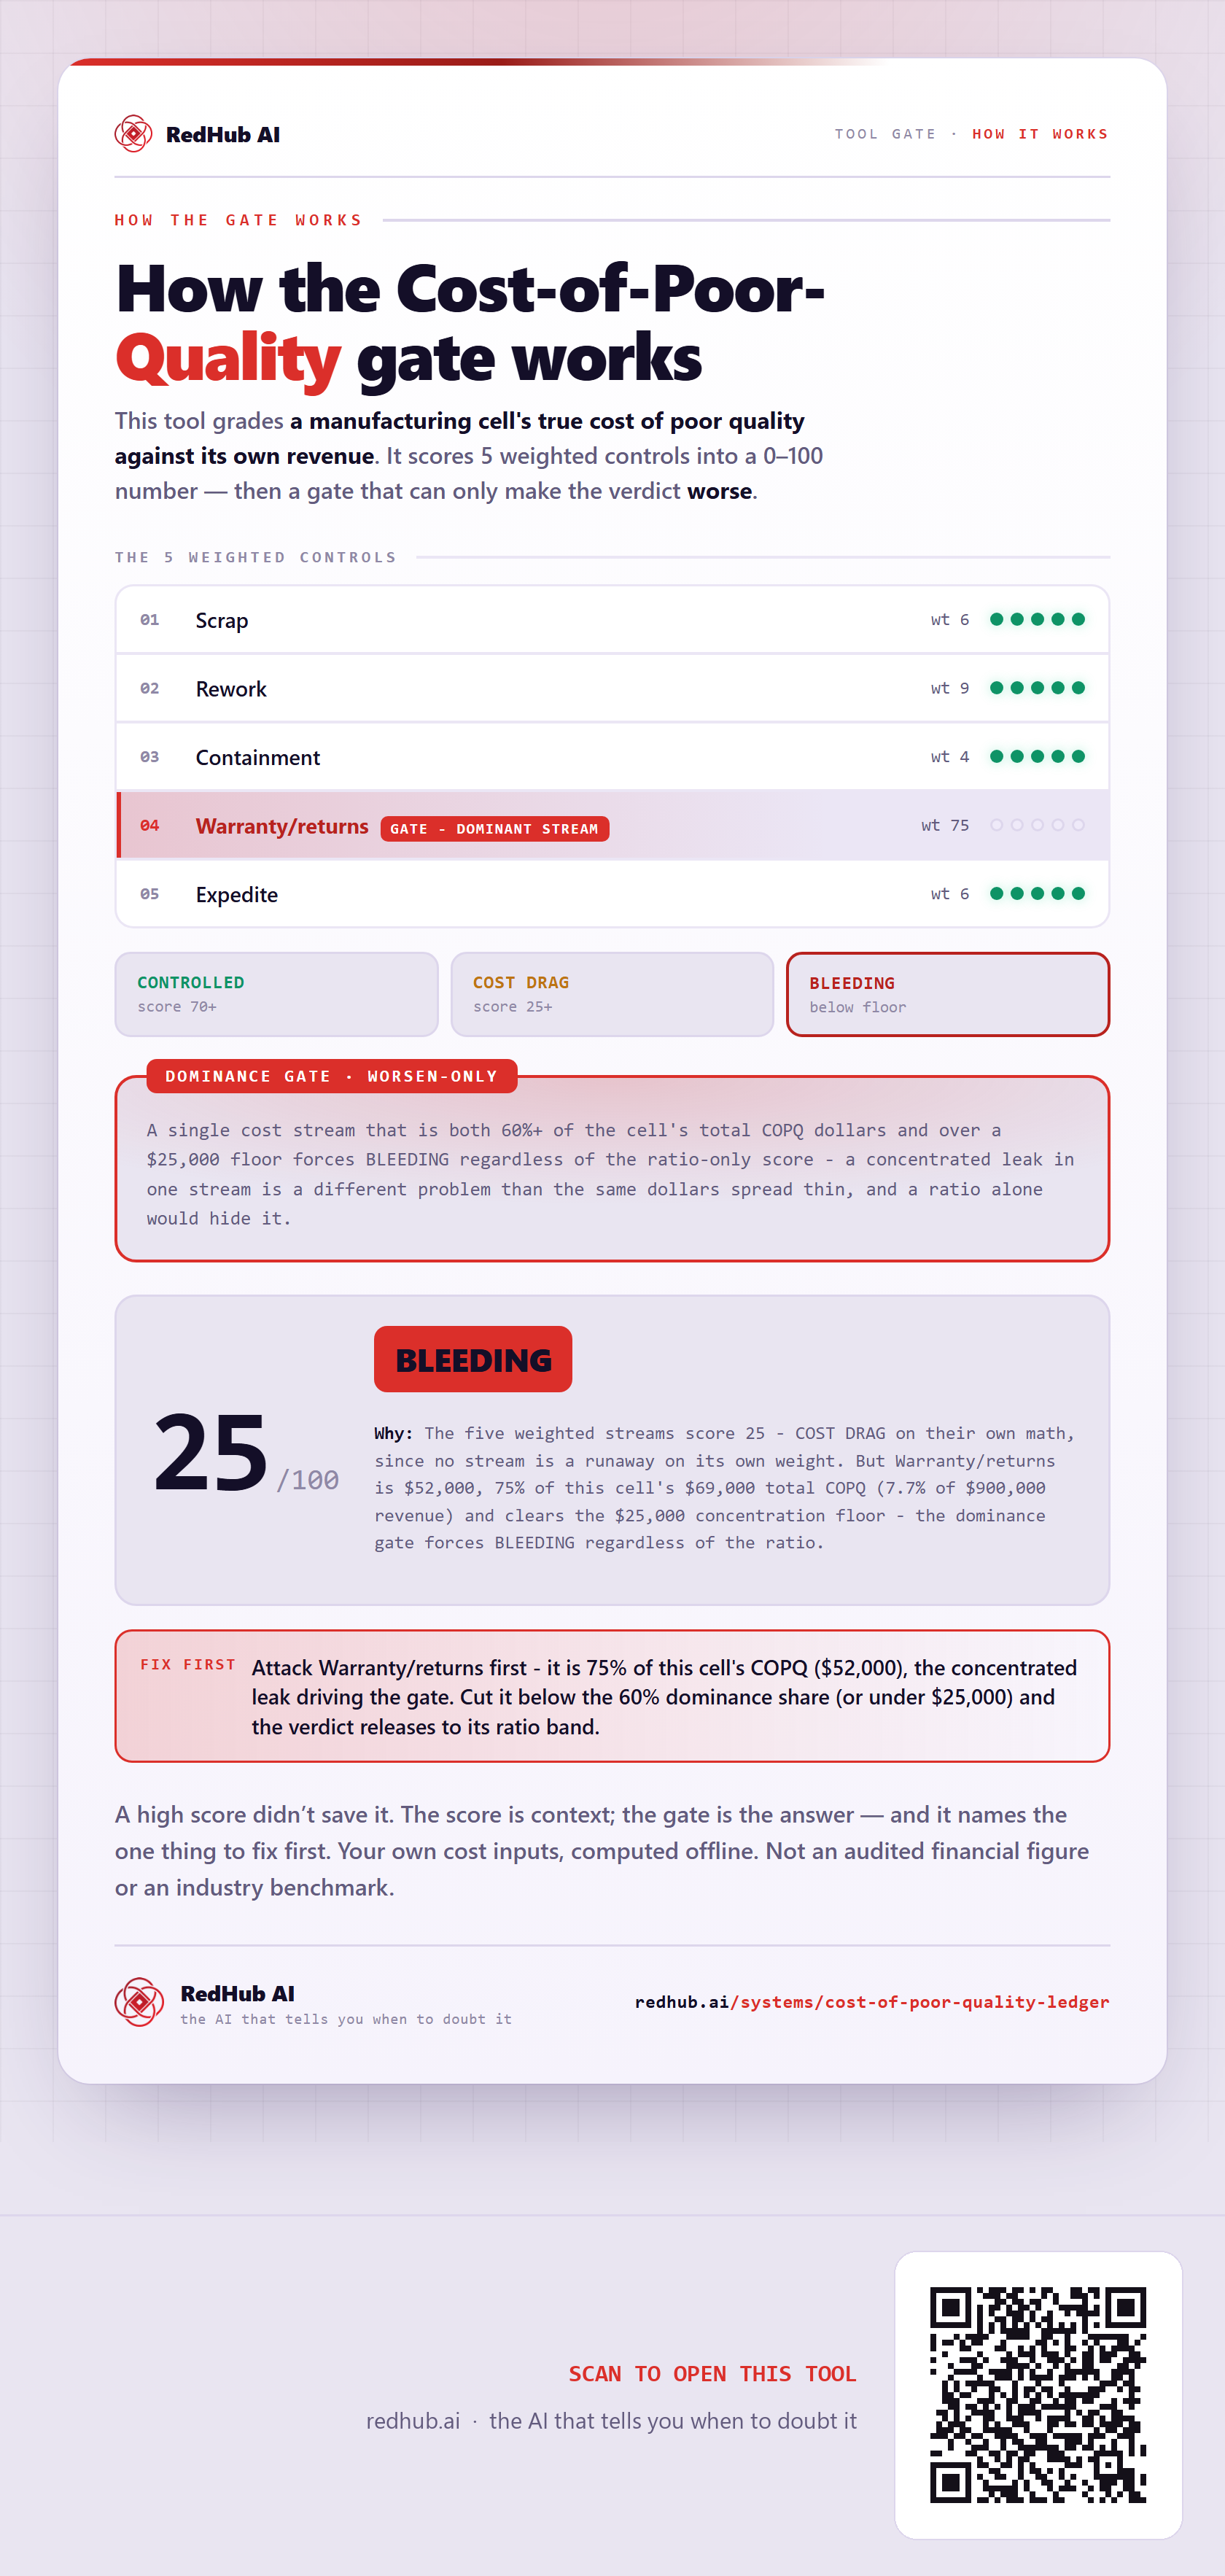
How the Cost-of-Poor-Quality Ledger grades each cell and rolls up the plant: five cost streams sum to one COPQ% per cell, banded at 5% and 12% of the cell's own revenue; a dominance gate reads BLEEDING when one stream is 60% or more of the cell's COPQ and $25,000 or more; and the plant verdict is its worst cell. That is how Weld cell A at 7.7% reads BLEEDING with Warranty/returns at 75.4%, and the plant reads MARGIN BLEEDING.
How the gate works
This tool grades each manufacturing cell's cost of poor quality against its own revenue. It reads 6 cells and rolls them into one verdict — the worst, never the average. Before the roll-up, the dominance gate reads each cell: where one stream is 60% or more of the cell's COPQ dollars and is $25,000 or more, the cell reads BLEEDING whatever its COPQ%. The gate can only make a cell's verdict worse.
The 6 cells
| Cell | Verdict |
|---|---|
| Weld cell Agated | BLEEDINGCOPQ 7.7% · Warranty/returns 75.4%, $52,000 |
| Weld cell A (warranty fixed) | CONTROLLEDCOPQ 2.9% · Warranty/returns 34.6% |
| Machining cell B | COST DRAGCOPQ 6.8% · Scrap 46.3% |
| Assembly cell C | CONTROLLEDCOPQ 3.5% · Scrap 34.6% |
| Paint line D | CONTROLLEDCOPQ 1.7% · Scrap 30.0% |
| Final QC gatefix first | BLEEDINGCOPQ 14.7% · $880,000 a year |
The verdict bands
A cell where one cost stream is 60% or more of the cell's COPQ dollars, and that stream is $25,000 or more, reads BLEEDING whatever its COPQ%. A concentrated leak in one stream is a different problem than the same dollars spread thin, and a ratio alone would hide it. The cell releases to its ratio band when the stream falls under 60% of the total or under $25,000.
In the worked sample it reads MARGIN BLEEDING — Six cells, each graded against its own revenue. Three read CONTROLLED and Machining cell B reads COST DRAG at 6.8%. Two read BLEEDING: Final QC gate on its ratio, at 14.7%, and Weld cell A through the gate. Weld cell A is at 7.7%, inside the COST DRAG range, but Warranty/returns is $52,000, which is 75.4% of its $69,000 COPQ, so the dominance gate reads it BLEEDING. The plant takes its worst cell and reads MARGIN BLEEDING. Marked fix first on this sample: Final QC gate: of the two BLEEDING cells it carries the larger projected annual COPQ, $880,000, with Containment its largest stream.
Common questions
Can a cell with a moderate COPQ% still read BLEEDING on the Cost-of-Poor-Quality Ledger?
Yes. Each cell's COPQ% is banded at 5% and 12% of its own revenue, and a worsen-only dominance gate then reads BLEEDING on any cell where one stream is 60% or more of its COPQ dollars and is $25,000 or more. In the worked sample Weld cell A is at 7.7%, inside the COST DRAG range, and reads BLEEDING because Warranty/returns is $52,000, which is 75.4% of its $69,000.
How does one cell set the plant verdict?
The plant verdict is the worst cell, never the average: any BLEEDING cell reads MARGIN BLEEDING, otherwise any COST DRAG cell reads MARGIN LEAKING, otherwise QUALITY COST CONTROLLED. In the worked sample three of six cells read CONTROLLED and the plant still reads MARGIN BLEEDING, because Weld cell A and Final QC gate both read BLEEDING.
Your own cost inputs, computed offline. Not an audited financial figure or an industry benchmark.
Embed this diagram
Free to share and embed with attribution (CC BY 4.0) — keep the link to redhub.ai.
Interactive — renders the live diagram
<iframe src="https://redhub.ai/visuals/tool/cost-of-poor-quality-ledger.html" title="How the Cost-of-Poor-Quality Ledger gate works — RedHub AI" width="760" height="1874" loading="lazy" style="border:0;width:100%;max-width:760px"></iframe>
<p style="font:14px/1.5 system-ui,sans-serif"><a href="https://redhub.ai/visuals/tool/cost-of-poor-quality-ledger">How the Cost-of-Poor-Quality Ledger gate works</a> — by <a href="https://redhub.ai">RedHub AI</a>, the AI that tells you when to doubt it.</p>
Image + link — a static picture for any blog
<a href="https://redhub.ai/visuals/tool/cost-of-poor-quality-ledger"><img src="https://redhub.ai/visuals/tool/cost-of-poor-quality-ledger-share.png" alt="Diagram of the Cost-of-Poor-Quality Ledger: six cells with COPQ% and verdicts, a dominance gate reading Weld cell A BLEEDING at 7.7%, and a plant verdict of MARGIN BLEEDING." width="760" loading="lazy" style="max-width:100%;height:auto;border-radius:16px"></a>
<p style="font:14px/1.5 system-ui,sans-serif"><a href="https://redhub.ai">RedHub AI</a> — the AI that tells you when to doubt it.</p>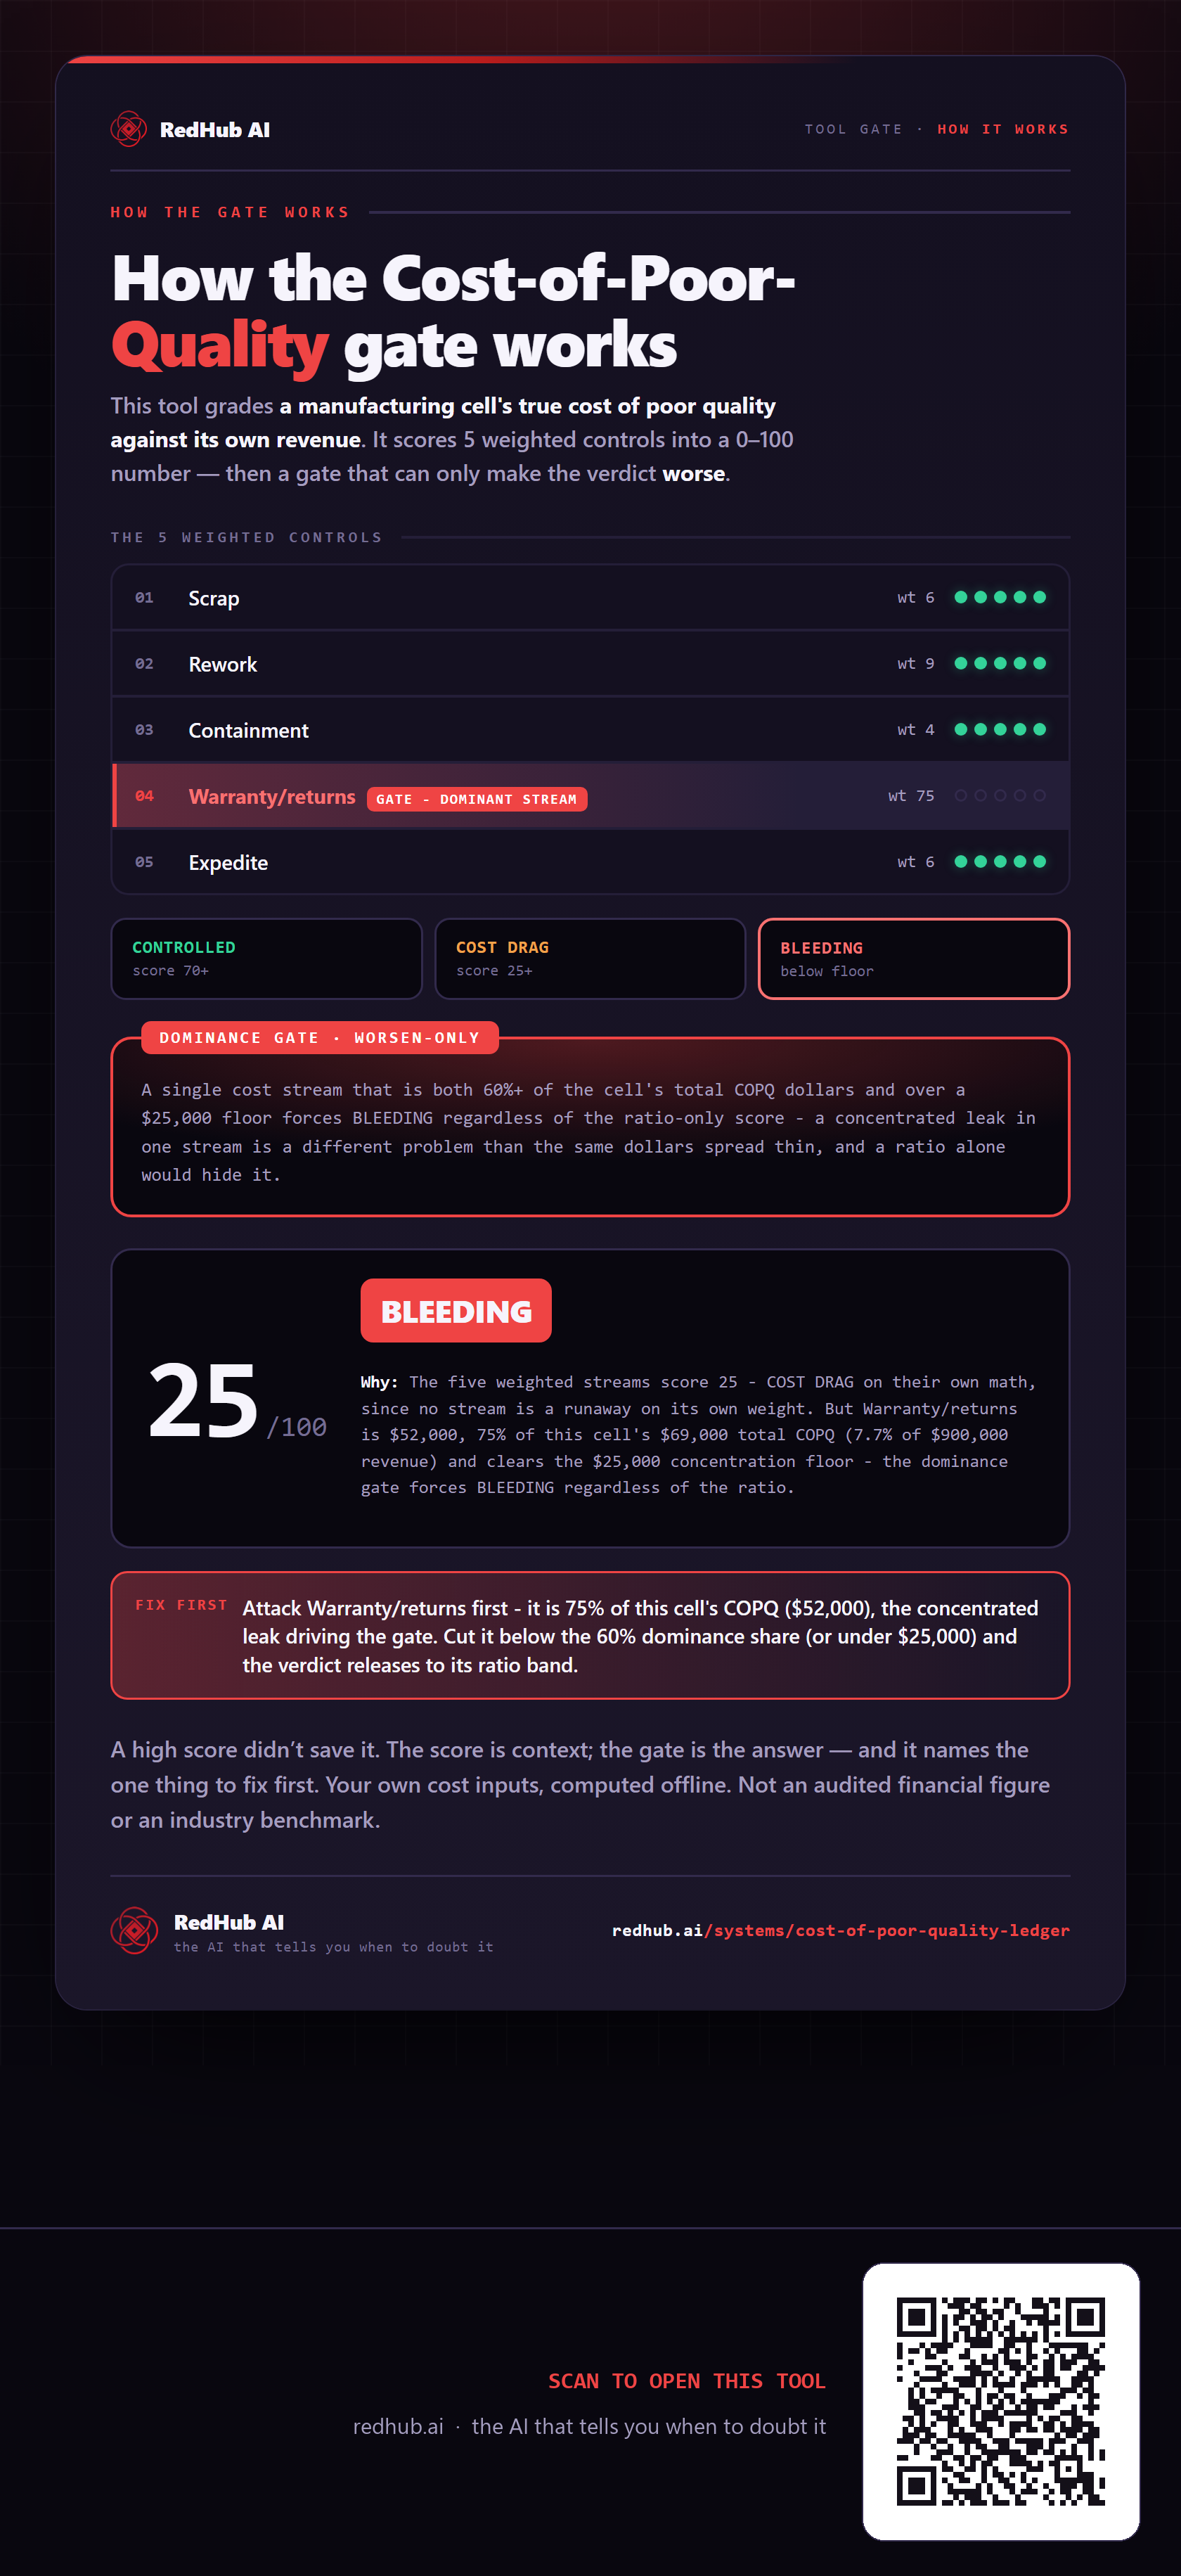
This is how Cost-of-Poor-Quality Ledger works. More diagrams in the Visual Field Guide.