Your cost of poor qualityis real. It’s just scattered.
Scrap, rework, sorting, warranty, and expedite-to-cover-an-escape live in five different GL accounts and are never totaled together — so the number that would make someone act never lands on a desk. This ledger sums all five per cell, projects it monthly and annually, and, where a cell is outside your tolerances, names the worst cell and the one stream driving it. Summed and attributed, COPQ is undeniable.
The most expensive number in the plant is the one nobody adds up.
hold the cost of poor quality — scrap, rework, containment, warranty, expedite. Each looks small alone. Nobody owns the sum.
of revenue is where COPQ typically hides in a plant that has never measured it — but you don’t need that stat. You need your own number.
often drives most of a cell’s COPQ. A cost that’s one runaway leak is a different fix than diffuse cost — if you can see it.
Every quality consultant arrives with a benchmark: “COPQ is 15–20% of revenue, you’re probably losing millions.” It may be true, and it changes nothing, because a borrowed percentage doesn’t survive contact with a CFO. What survives is your own scrap, your own warranty claims, your own expedite premiums, summed against your own revenue. That’s arithmetic on data you already have — scattered across five accounts that were never meant to be added together.
Sum a cell. Watch a modest 7.7% still read BLEEDING.
Live ledger · evaluated 2026-06-30
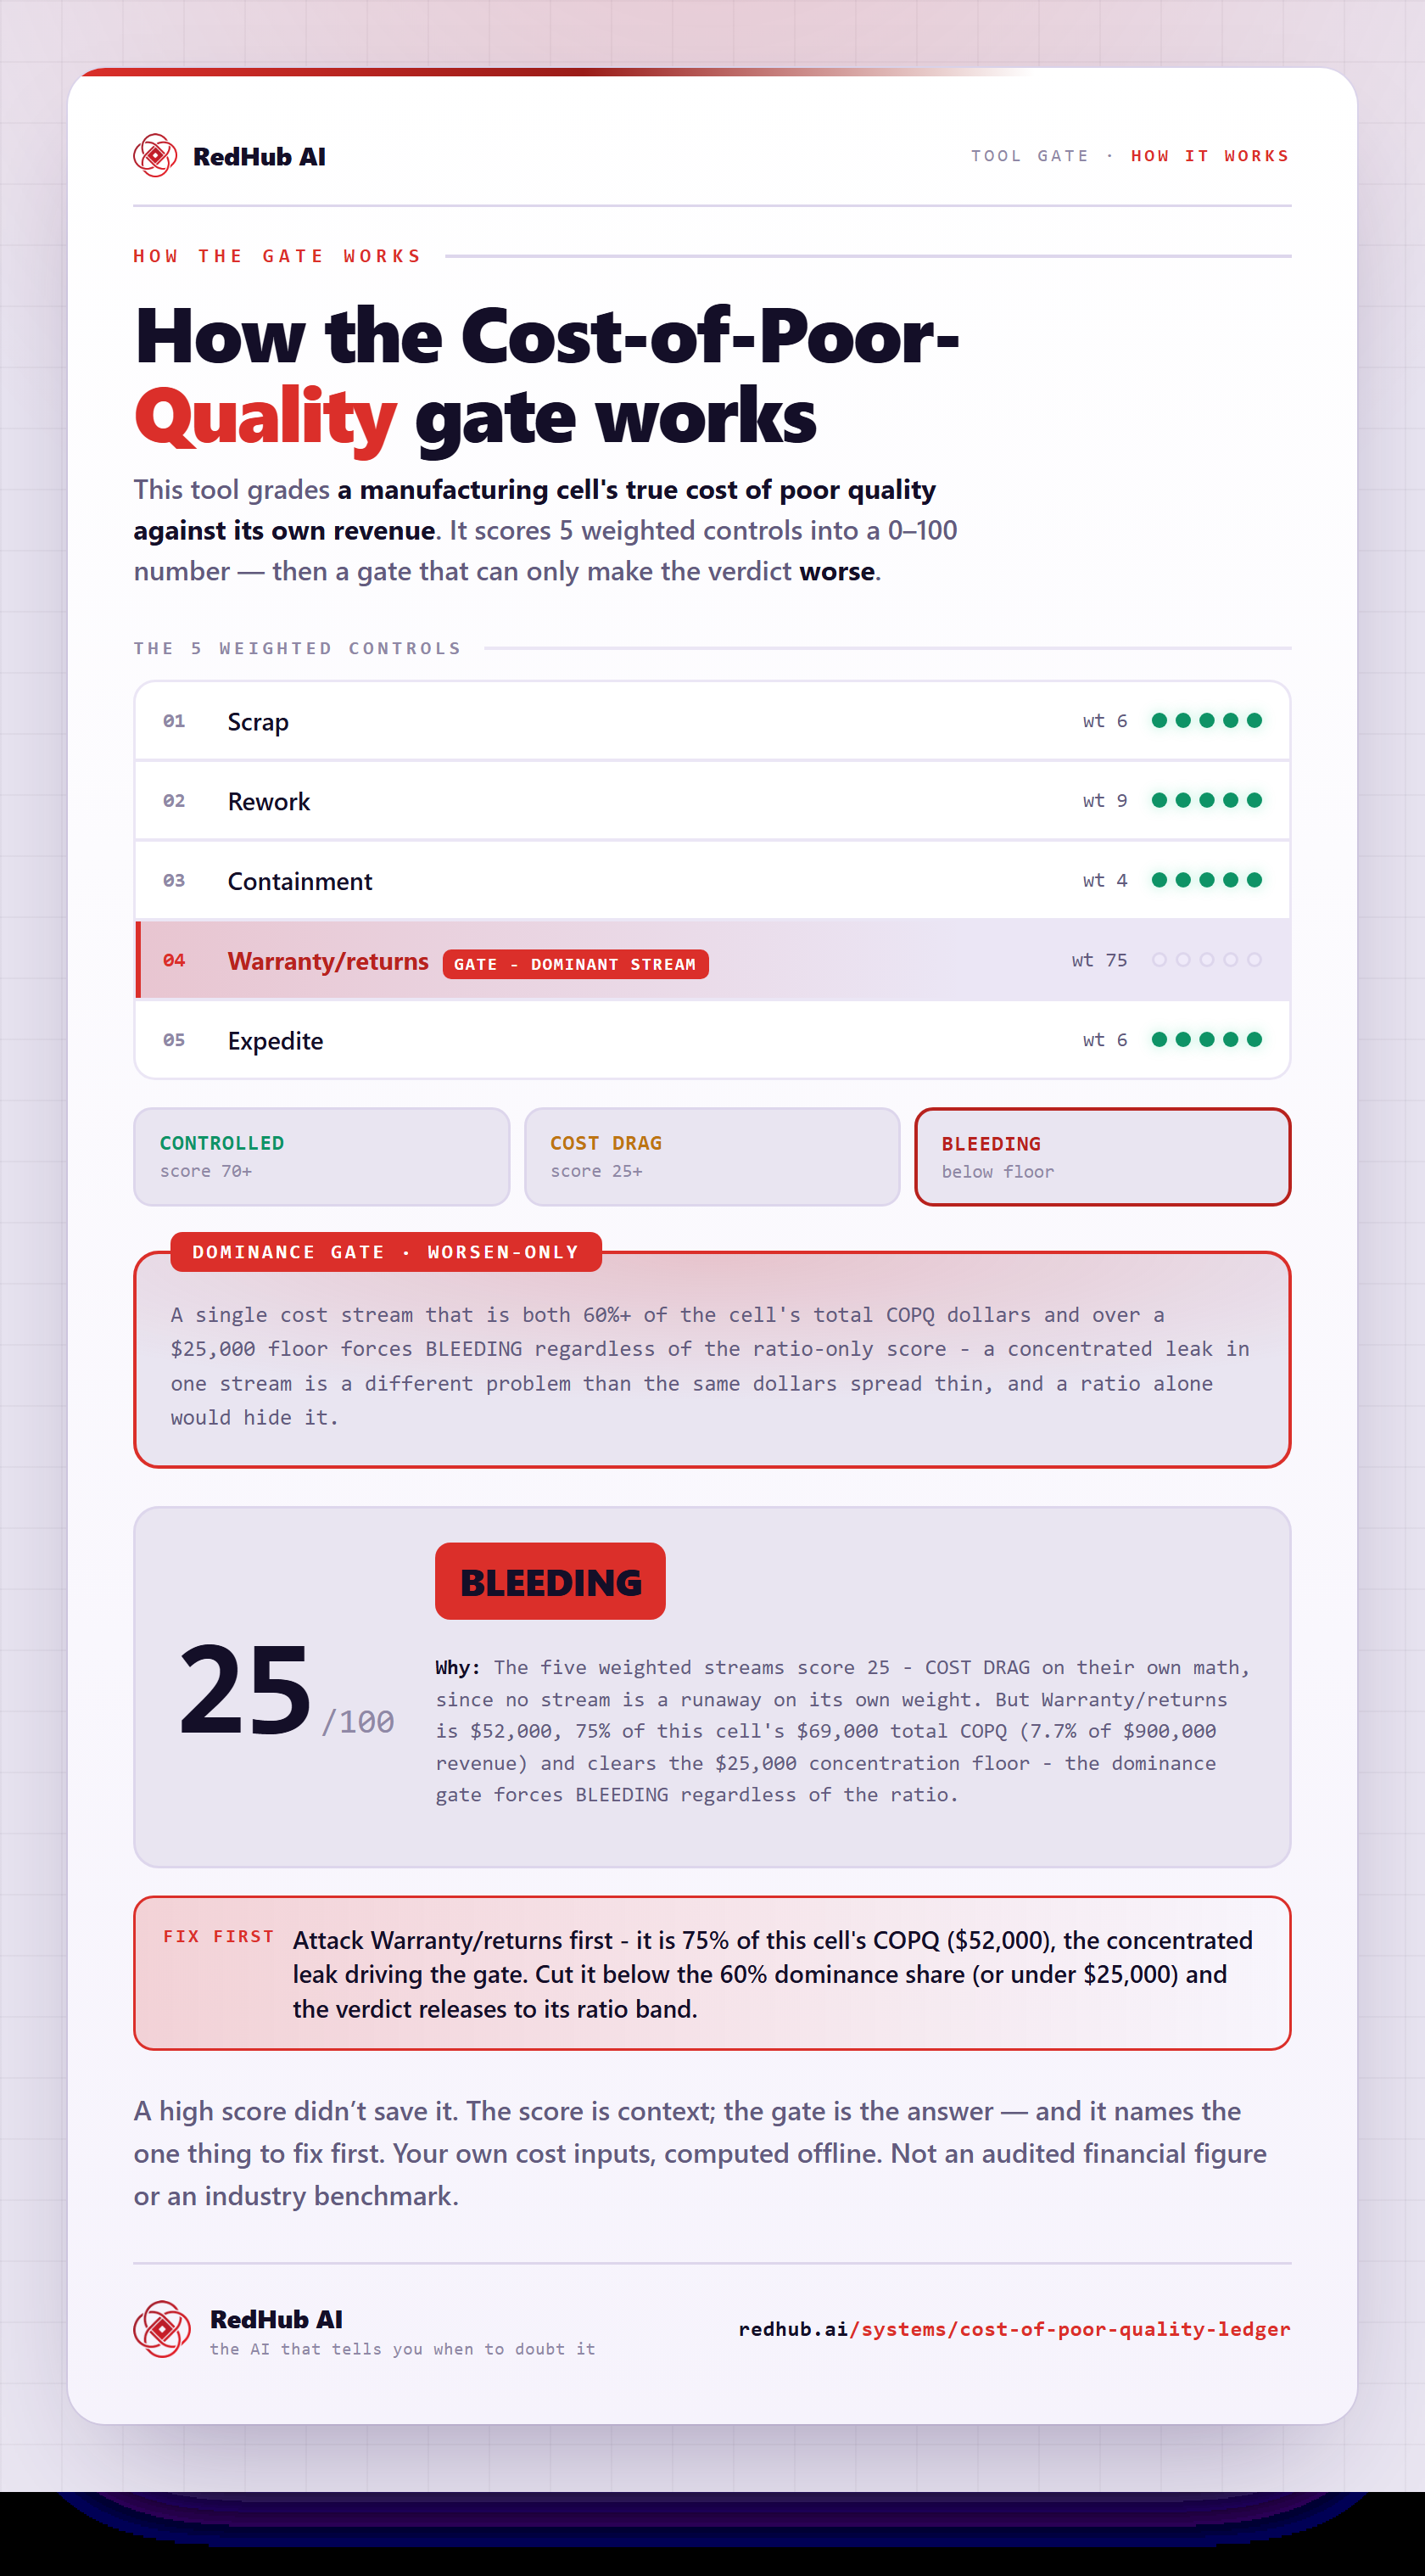
Fix: Attack Warranty/returns — it is 75% of this cell’s COPQ ($52,000)
One stream is both dominant (≥60% of COPQ) and over the $25,000 floor — a concentrated leak forces BLEEDING regardless of the ratio. Diversify or reduce it and the cell releases to its ratio band.
Every dollar is your own input — no industry multiplier. Scores a cost structure, never a person.
How the gate works, in one image
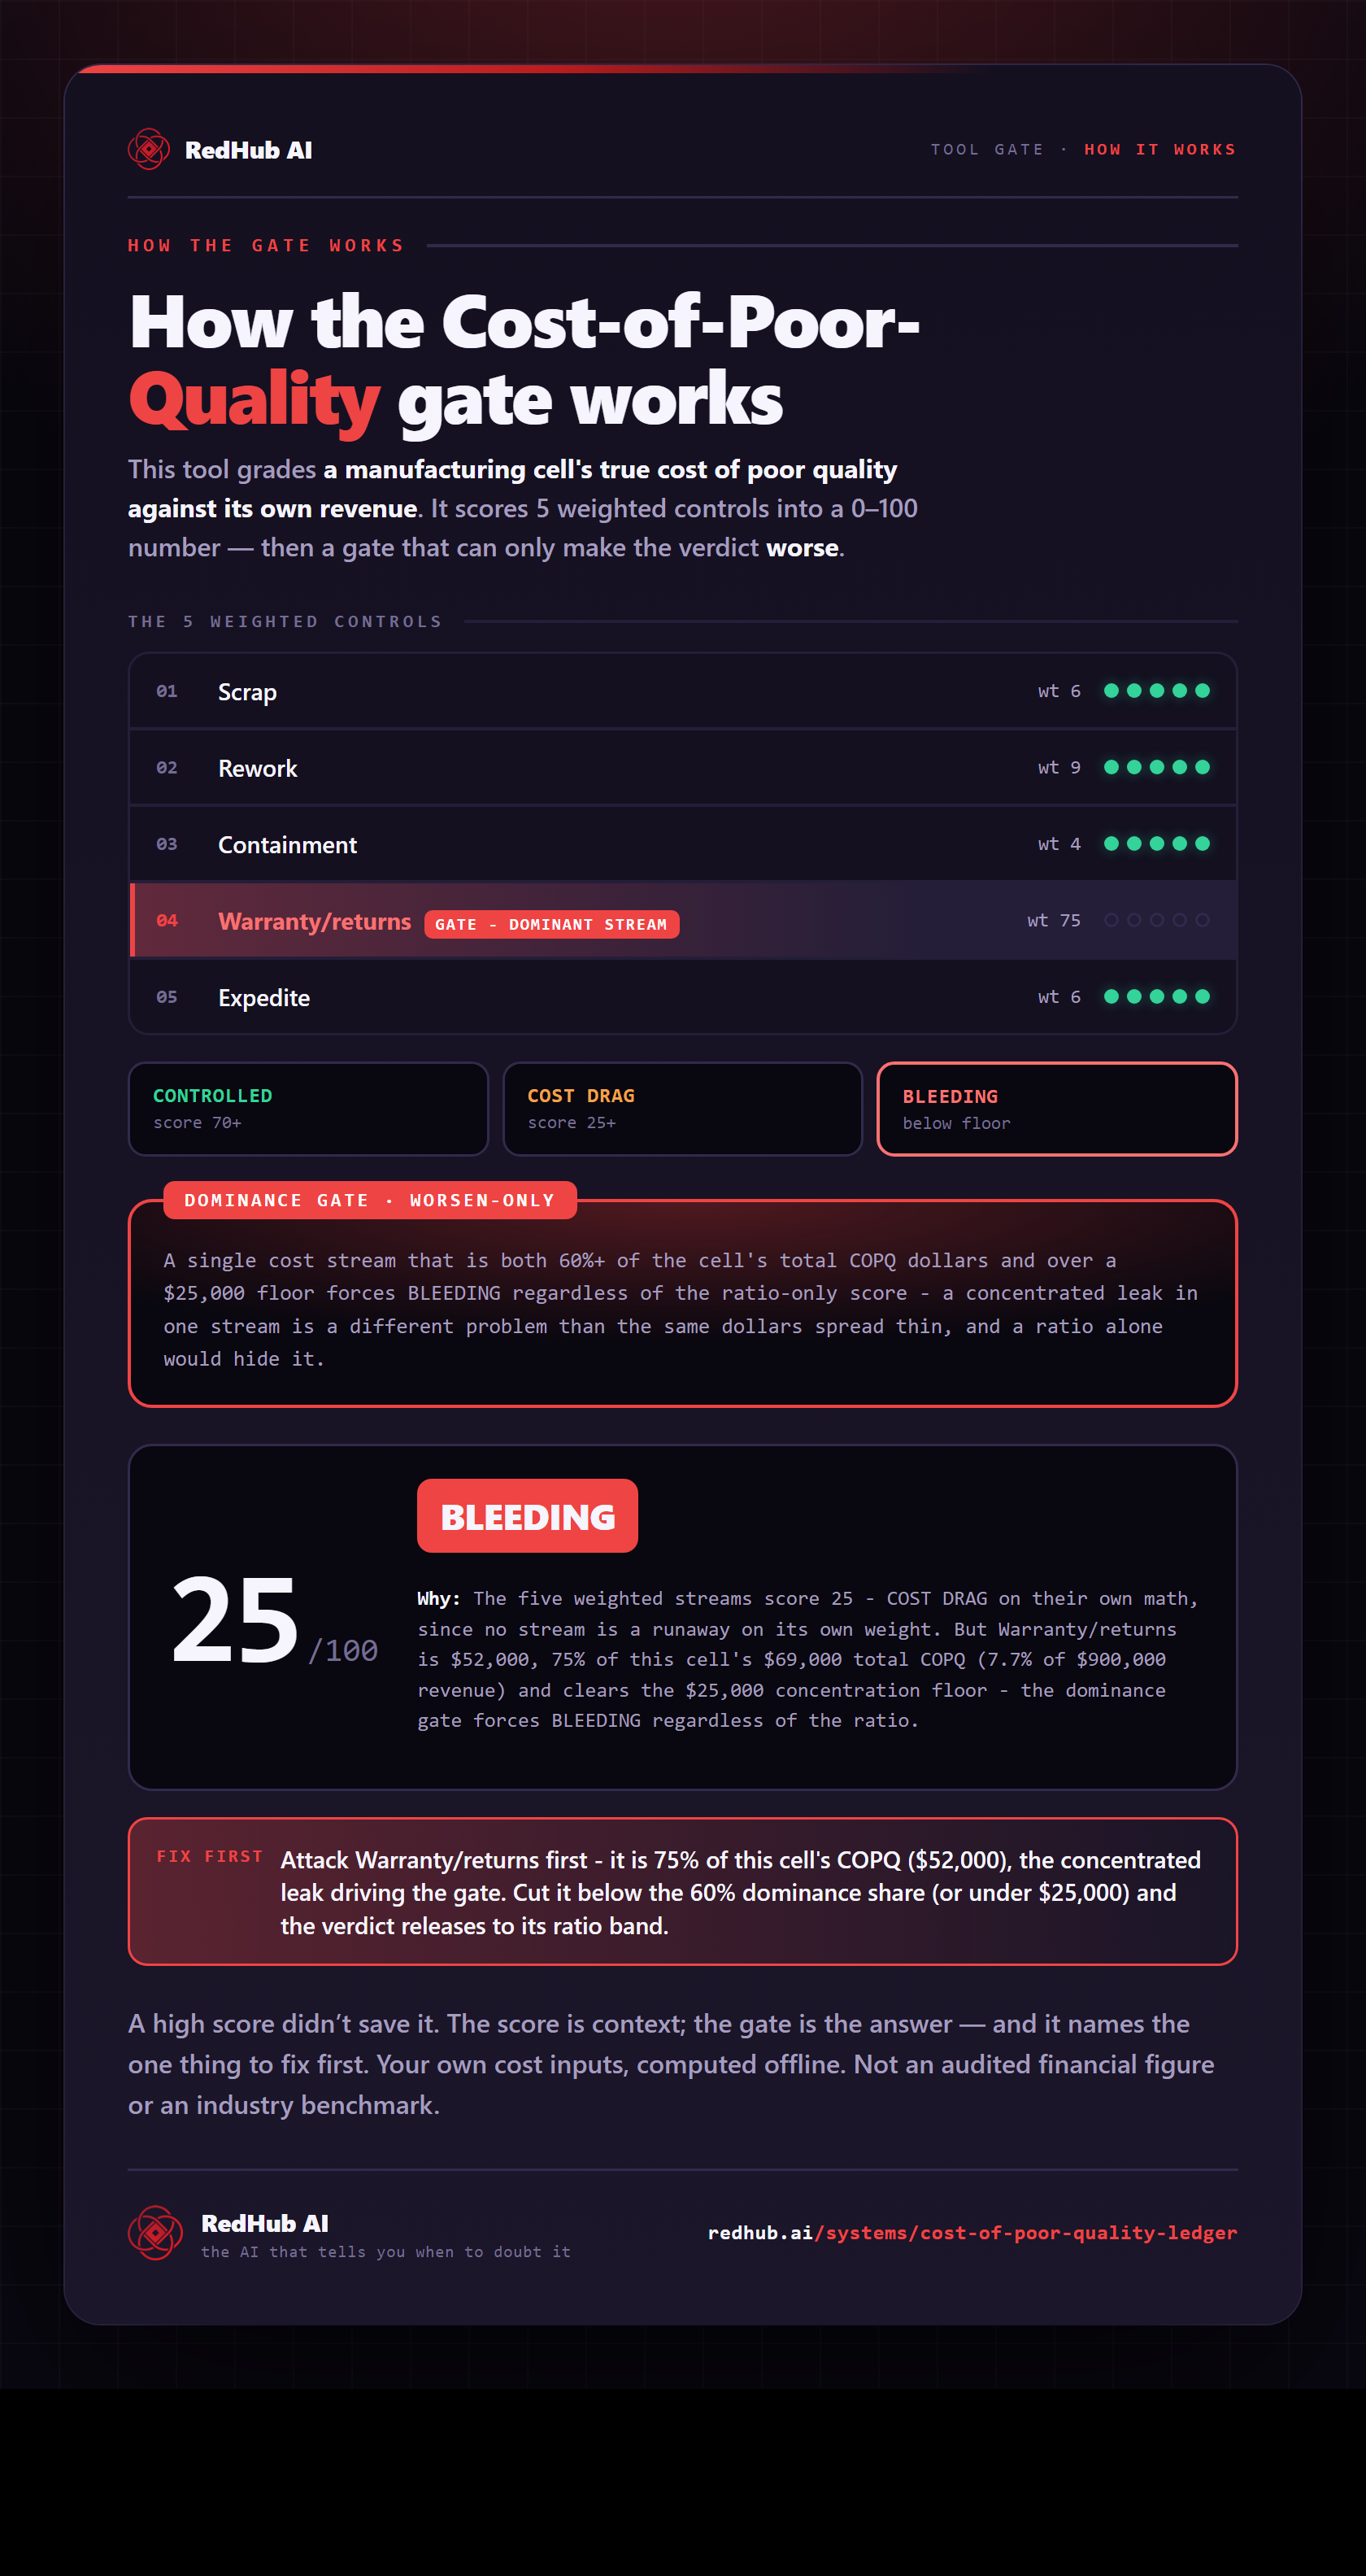
How the Cost-of-Poor-Quality Ledger turns five cost streams into one COPQ% and a dominance gate that names the stream eating the number — the same math the demo runs, as a diagram you can share or embed anywhere.
View & embed the full diagramThe worked cell runs at 7.7% COPQ — the kind of number that reads as background noise — yet it’s BLEEDING, because warranty alone is 75% of its cost and over the dollar floor. A cost that’s one runaway stream is a fire the ratio hides. Fix the warranty stream and the same cell releases to CONTROLLED. Every dollar is a figure you enter; nothing is invented.
One command consolidates the ledger and, where a cell is outside your tolerances, names the one to fix first.
$ python3 copq_ledger.py sample_cells.csv --as-of 2026-06-30
======================================================================
COST-OF-POOR-QUALITY LEDGER  -  RedHub AI  (CPQ-099)
Evaluation date: 2026-06-30
======================================================================

Cell: Weld cell A
  Streams (scrap/rework/contain/warranty/expedite):
    $4,000 / $6,000 / $3,000 / $52,000 / $4,000
  Total COPQ / COPQ%              : $69,000 / 7.7%
  Monthly / Annual (projected)   : $23,000 / $276,000
  Dominant stream                : Warranty/returns (75.4%)  <- concentrated leak
  VERDICT                        : BLEEDING
  Fix                            : Attack Warranty/returns - it is 75% of this cell's COPQ ($52,000)

Cell: Weld cell A (warranty fixed)
  Streams (scrap/rework/contain/warranty/expedite):
    $4,000 / $6,000 / $3,000 / $9,000 / $4,000
  Total COPQ / COPQ%              : $26,000 / 2.9%
  Monthly / Annual (projected)   : $8,667 / $104,000
  Dominant stream                : Warranty/returns (34.6%)
  VERDICT                        : CONTROLLED

Cell: Machining cell B
  Streams (scrap/rework/contain/warranty/expedite):
    $38,000 / $22,000 / $9,000 / $7,000 / $6,000
  Total COPQ / COPQ%              : $82,000 / 6.8%
  Monthly / Annual (projected)   : $27,333 / $328,000
  Dominant stream                : Scrap (46.3%)
  VERDICT                        : COST DRAG
  Fix                            : Reduce Scrap first (largest stream)

Cell: Assembly cell C
  Streams (scrap/rework/contain/warranty/expedite):
    $9,000 / $7,000 / $5,000 / $3,000 / $2,000
  Total COPQ / COPQ%              : $26,000 / 3.5%
  Monthly / Annual (projected)   : $8,667 / $104,000
  Dominant stream                : Scrap (34.6%)
  VERDICT                        : CONTROLLED

Cell: Paint line D
  Streams (scrap/rework/contain/warranty/expedite):
    $3,000 / $2,500 / $2,000 / $1,500 / $1,000
  Total COPQ / COPQ%              : $10,000 / 1.7%
  Monthly / Annual (projected)   : $3,333 / $40,000
  Dominant stream                : Scrap (30.0%)
  VERDICT                        : CONTROLLED

Cell: Final QC gate
  Streams (scrap/rework/contain/warranty/expedite):
    $52,000 / $41,000 / $60,000 / $38,000 / $29,000
  Total COPQ / COPQ%              : $220,000 / 14.7%
  Monthly / Annual (projected)   : $73,333 / $880,000
  Dominant stream                : Containment (27.3%)
  VERDICT                        : BLEEDING

----------------------------------------------------------------------
PLANT QUALITY-COST VERDICT : MARGIN BLEEDING
Org COPQ (monthly/annual)  : $144,333 / $1,732,000
Fix first (worst cell)     : Final QC gate (annual $880,000, dominant Containment)
----------------------------------------------------------------------
Every dollar is your own input - no industry multiplier. Scores a
cost structure, never a person. Not accounting, tax, or engineering
advice.
Stdlib-only Python. It sums the five streams, projects monthly and annual, flags the concentrated leak, and rolls the plant up worst-cell-wins. The workbook reproduces these exact figures, and the demo above computes the identical numbers — verified byte-for-byte on the shipped sample.
Three rules keep the number defensible.
Consolidate what's scattered
The five streams live in five accounts. The product's whole job is to total them per cell and project the figure — because the sum, not the parts, is what forces a decision.
Attribute to a cell and a stream
A plant-wide COPQ number is a shrug. Where a cell is outside your tolerances, this names the worst cell (worst verdict first, then annual dollars) and the single stream driving it, so the fix has an address.
Your dollars, your denominator
Every figure is your own input; COPQ% is against your own revenue. No industry multiplier, no invented per-unit cost — which is what makes the number survive a finance review.
A consolidation ledger, not an accounting system or a benchmark.
- A deterministic, offline ledger you run on figures you already have.
- A monthly and annual COPQ projection per cell, with the worst cell named where one is outside your tolerances.
- A pointer to the one cost stream to attack first in each bleeding cell.
- Not an accounting system — it consolidates figures, it doesn’t book entries.
- It scores a cost structure, never a person or a named supplier.
- No baked-in benchmark; every dollar and tolerance is yours. Not accounting, tax, or engineering advice.
Anyone who owns a margin the plant is quietly spending.
- Quality and operations leaders who suspect COPQ is large but can't size it
- Plant managers building the business case for a quality investment
- CI and Lean teams choosing which cell and which stream to attack first
- Controllers and consultants who need a figure built from real numbers
- Booking journal entries — it consolidates, it doesn't post to the GL
- Ranking operators or suppliers — it scores a cost structure, not people
- Quoting an industry COPQ percentage — it computes yours from your data
- Replacing your ERP's cost accounting — it totals what the ERP keeps apart
The plant reliability desk.
OEE Honesty Grader
$99Grades whether your OEE number is honest — the throughput side of the same plant this ledger costs.
ViewPM Deferral & Pencil-Whip Tripwire
$89Catches the deferred and pencil-whipped PMs that turn into the warranty and scrap streams this ledger sums.
ViewManufacturing & Distribution Ops Pack
$89Seven Claude skills for the make-and-move surface, plus a runnable inventory auditor.
ViewThe honest answers.
Put the whole number
on one desk.
One purchase, lifetime access, 12 months of updates. $99, once.
Sold by RedHub AI LLC · Secured by Stripe · redhub.ai