Returns & Refund Profit Analyzer
See the true profit on each product after returns — and which ones to keep, fix, or drop. A return costs far more than the refund.
TL;DR
Returns quietly erase margin: the refunded sale, the processing cost, and the stock you can't resell at full price. This kit nets it all out per SKU, shows your worst offenders, and gives a keep / fix / drop verdict. The example loses $28,514 to returns — about 30% of its potential profit.
instant download · .xlsx · 30-day guarantee
The problem
A product can look profitable and still lose you money.
Gross margin looks healthy, so the product stays. But returns don't show up there — and a single return can cost a fifth to two-thirds of the item's price to handle, with less than half of returned goods reselling at full price.
Add it up per SKU and the high-return products reveal themselves — including the ones that are quietly underwater while their listing still looks like a winner.
in U.S. product returns in 2024
average online return rate
of an item's price can go to processing a single return
of returned items resell at full price — the rest is loss
Sources: Opensend 2025 (U.S. returns volume, online return rate, processing cost); TrueProfit (resale-at-full-price share).
What's inside
Four tabs, the real margin on every product.
One .xlsx — open it in Excel, Google Sheets, or Numbers and see your SKUs today.
Returns by SKU
List each product: units sold, price, unit cost, return rate, cost to process a return, and how much value you recover on returned items. The sheet returns each product's lost profit, true net profit, margin, and a verdict.
Returns Map
A profit-lost-to-returns chart by product, so your worst offenders are obvious at a glance — plus the total leak, the single worst product, and the count of products to fix or drop.
The verdict
Every product gets one of three calls — keep, fix returns, or drop-or-fix — based on its true net profit and whether its return rate is over your target. Money-losers are tinted red.
Action Plan & scripts
The return-cutting moves in order of impact (listing, recovery, cost-per-return, supplier) plus copy-paste scripts: a return-reason survey, a listing-fix brief, a supplier quality note, and AI prompts to analyze reasons or rewrite a listing.
How the verdict works
True profit, then the call
Net profit per product subtracts the full cost of every return — refunded margin, processing, and unrecovered stock. Margin and return rate set the verdict:
- Keep — returns in a healthy range and the product is profitable
- Fix returns — profitable but the return rate is over target and eating margin
- Drop or fix — loses money after returns — fix it hard, or discontinue
The built-in example · 8 products
Healthy on paper, underwater after a 40% return rate and low recovery.
Try it
Net out the true cost of returns
Profit lost to returns
$26,816
Net profit
$47,034
Returns vs. potential
36%
Blended net margin
53%
This is the live engine. Your numbers here reset when you reload. The kit saves every SKU, charts lost profit by product, and gives you the fix-returns / drop-or-fix playbook for each one.
Get the kit — $39| Product | Units | Price | Cost | Ret % | Rec % | Verdict |
|---|---|---|---|---|---|---|
| Fix returns | ||||||
| Fix returns | ||||||
| Fix returns | ||||||
| Drop or fix | ||||||
| Keep | ||||||
| Keep |
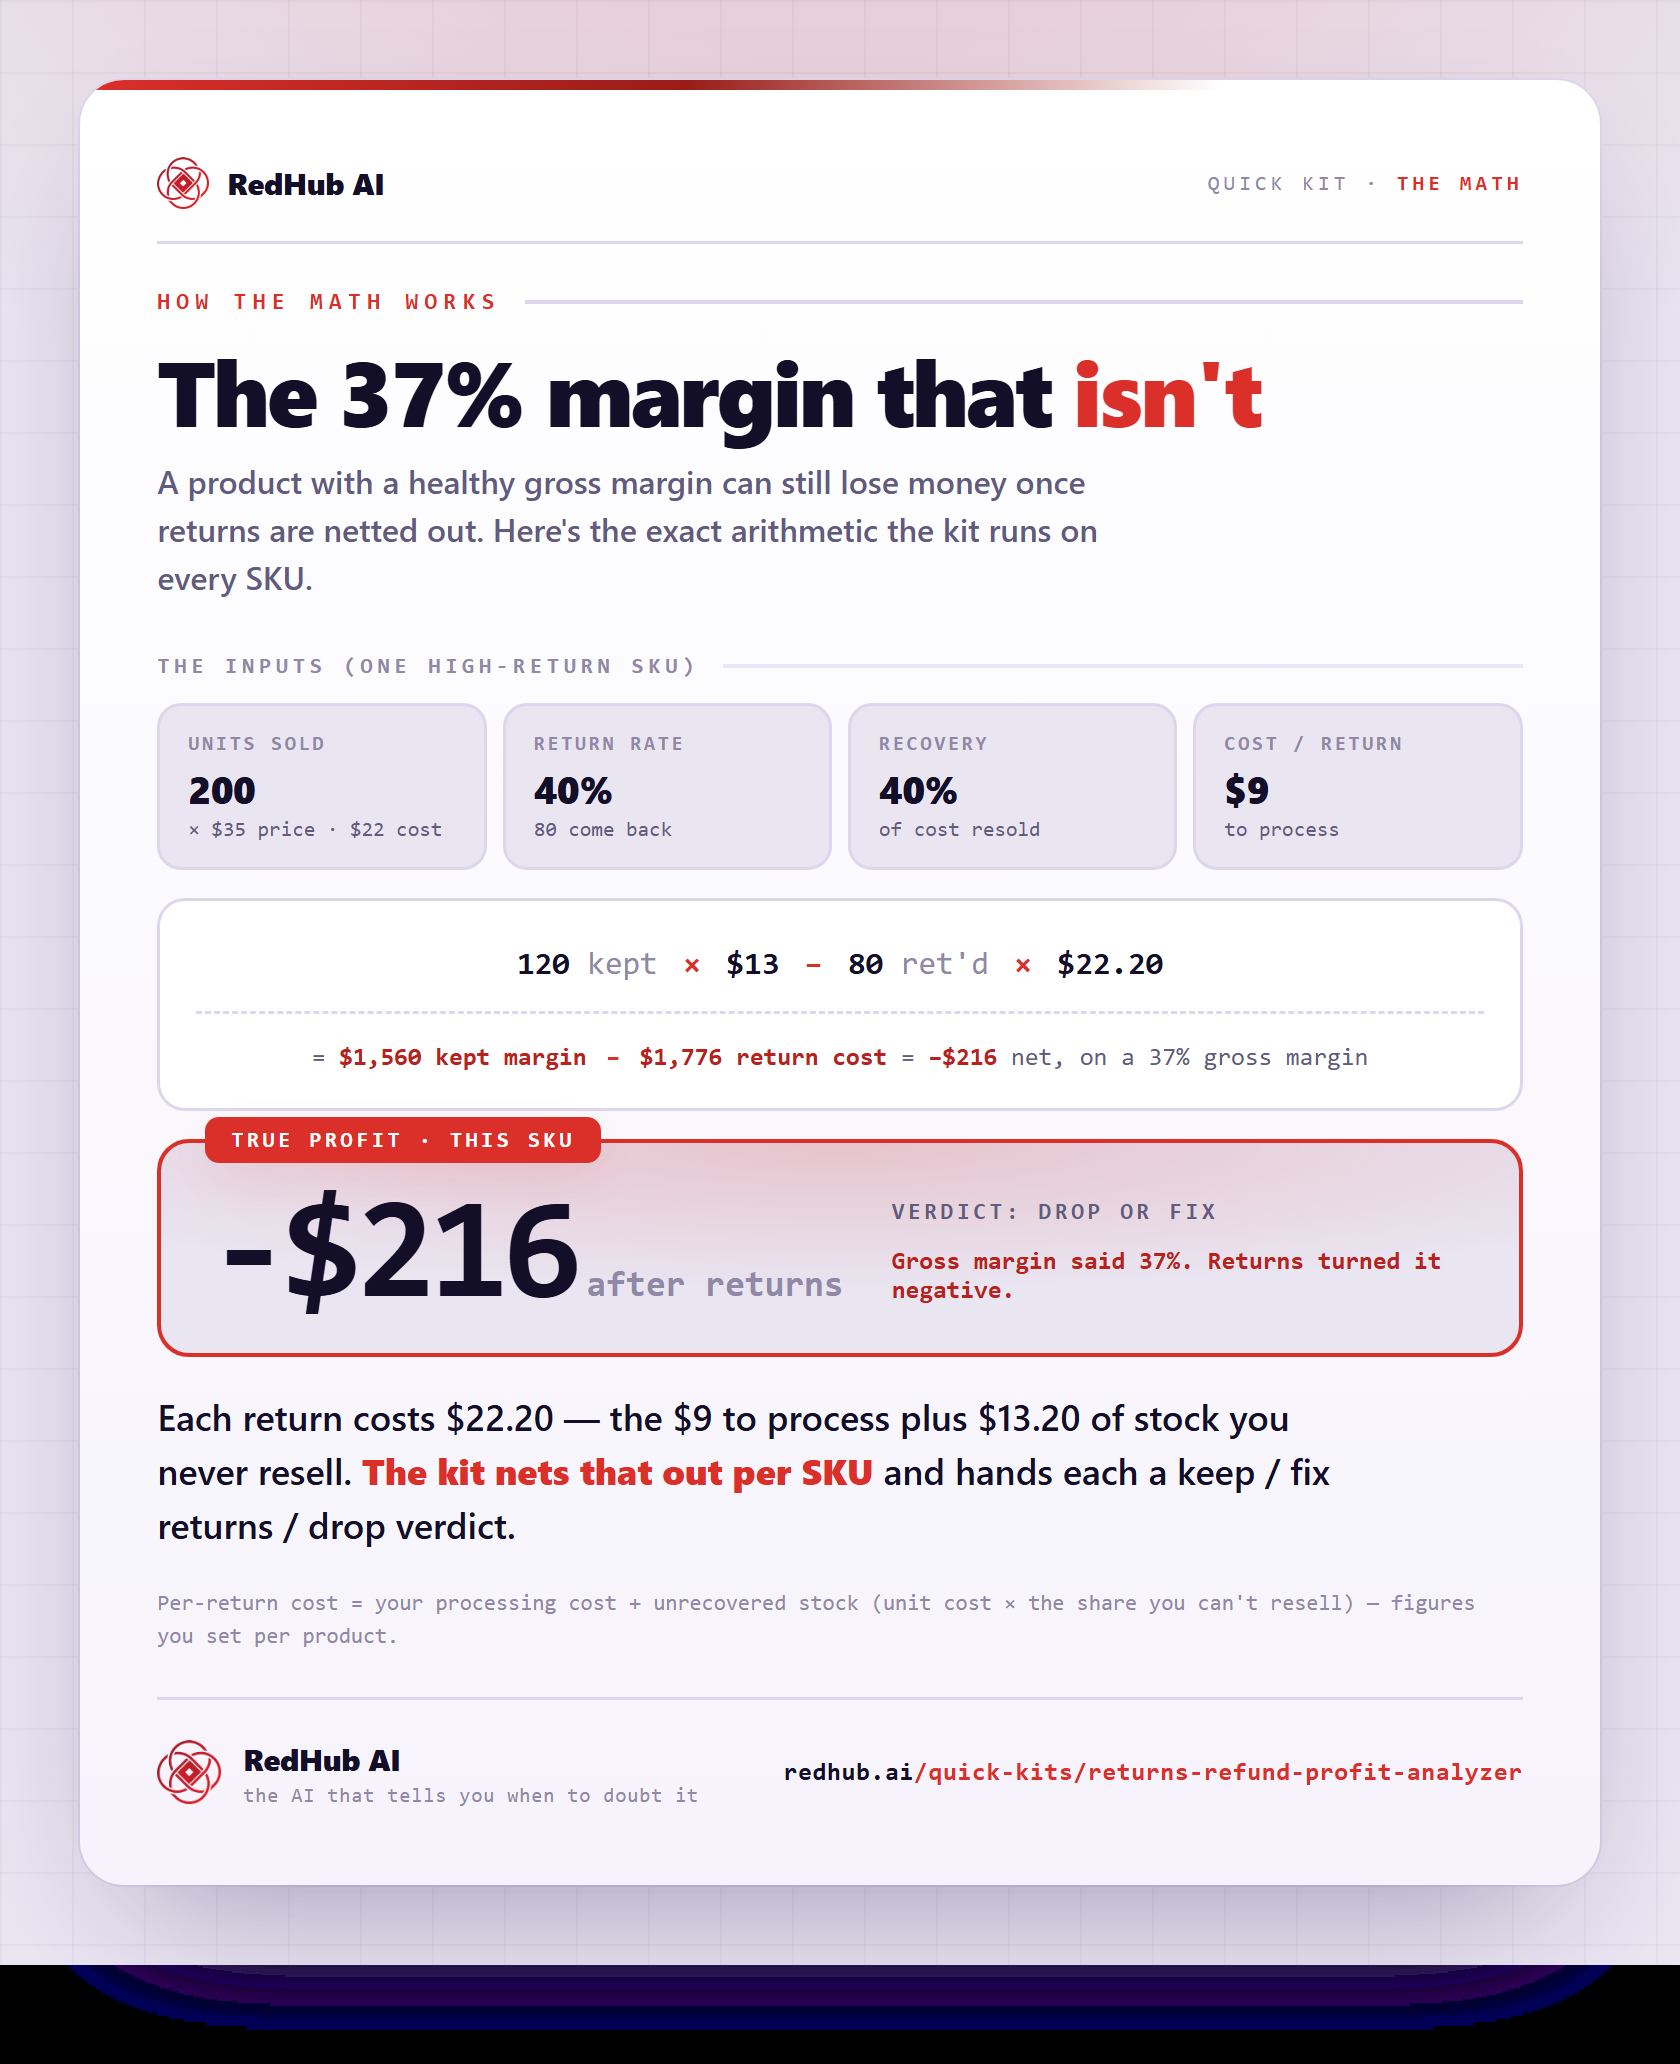
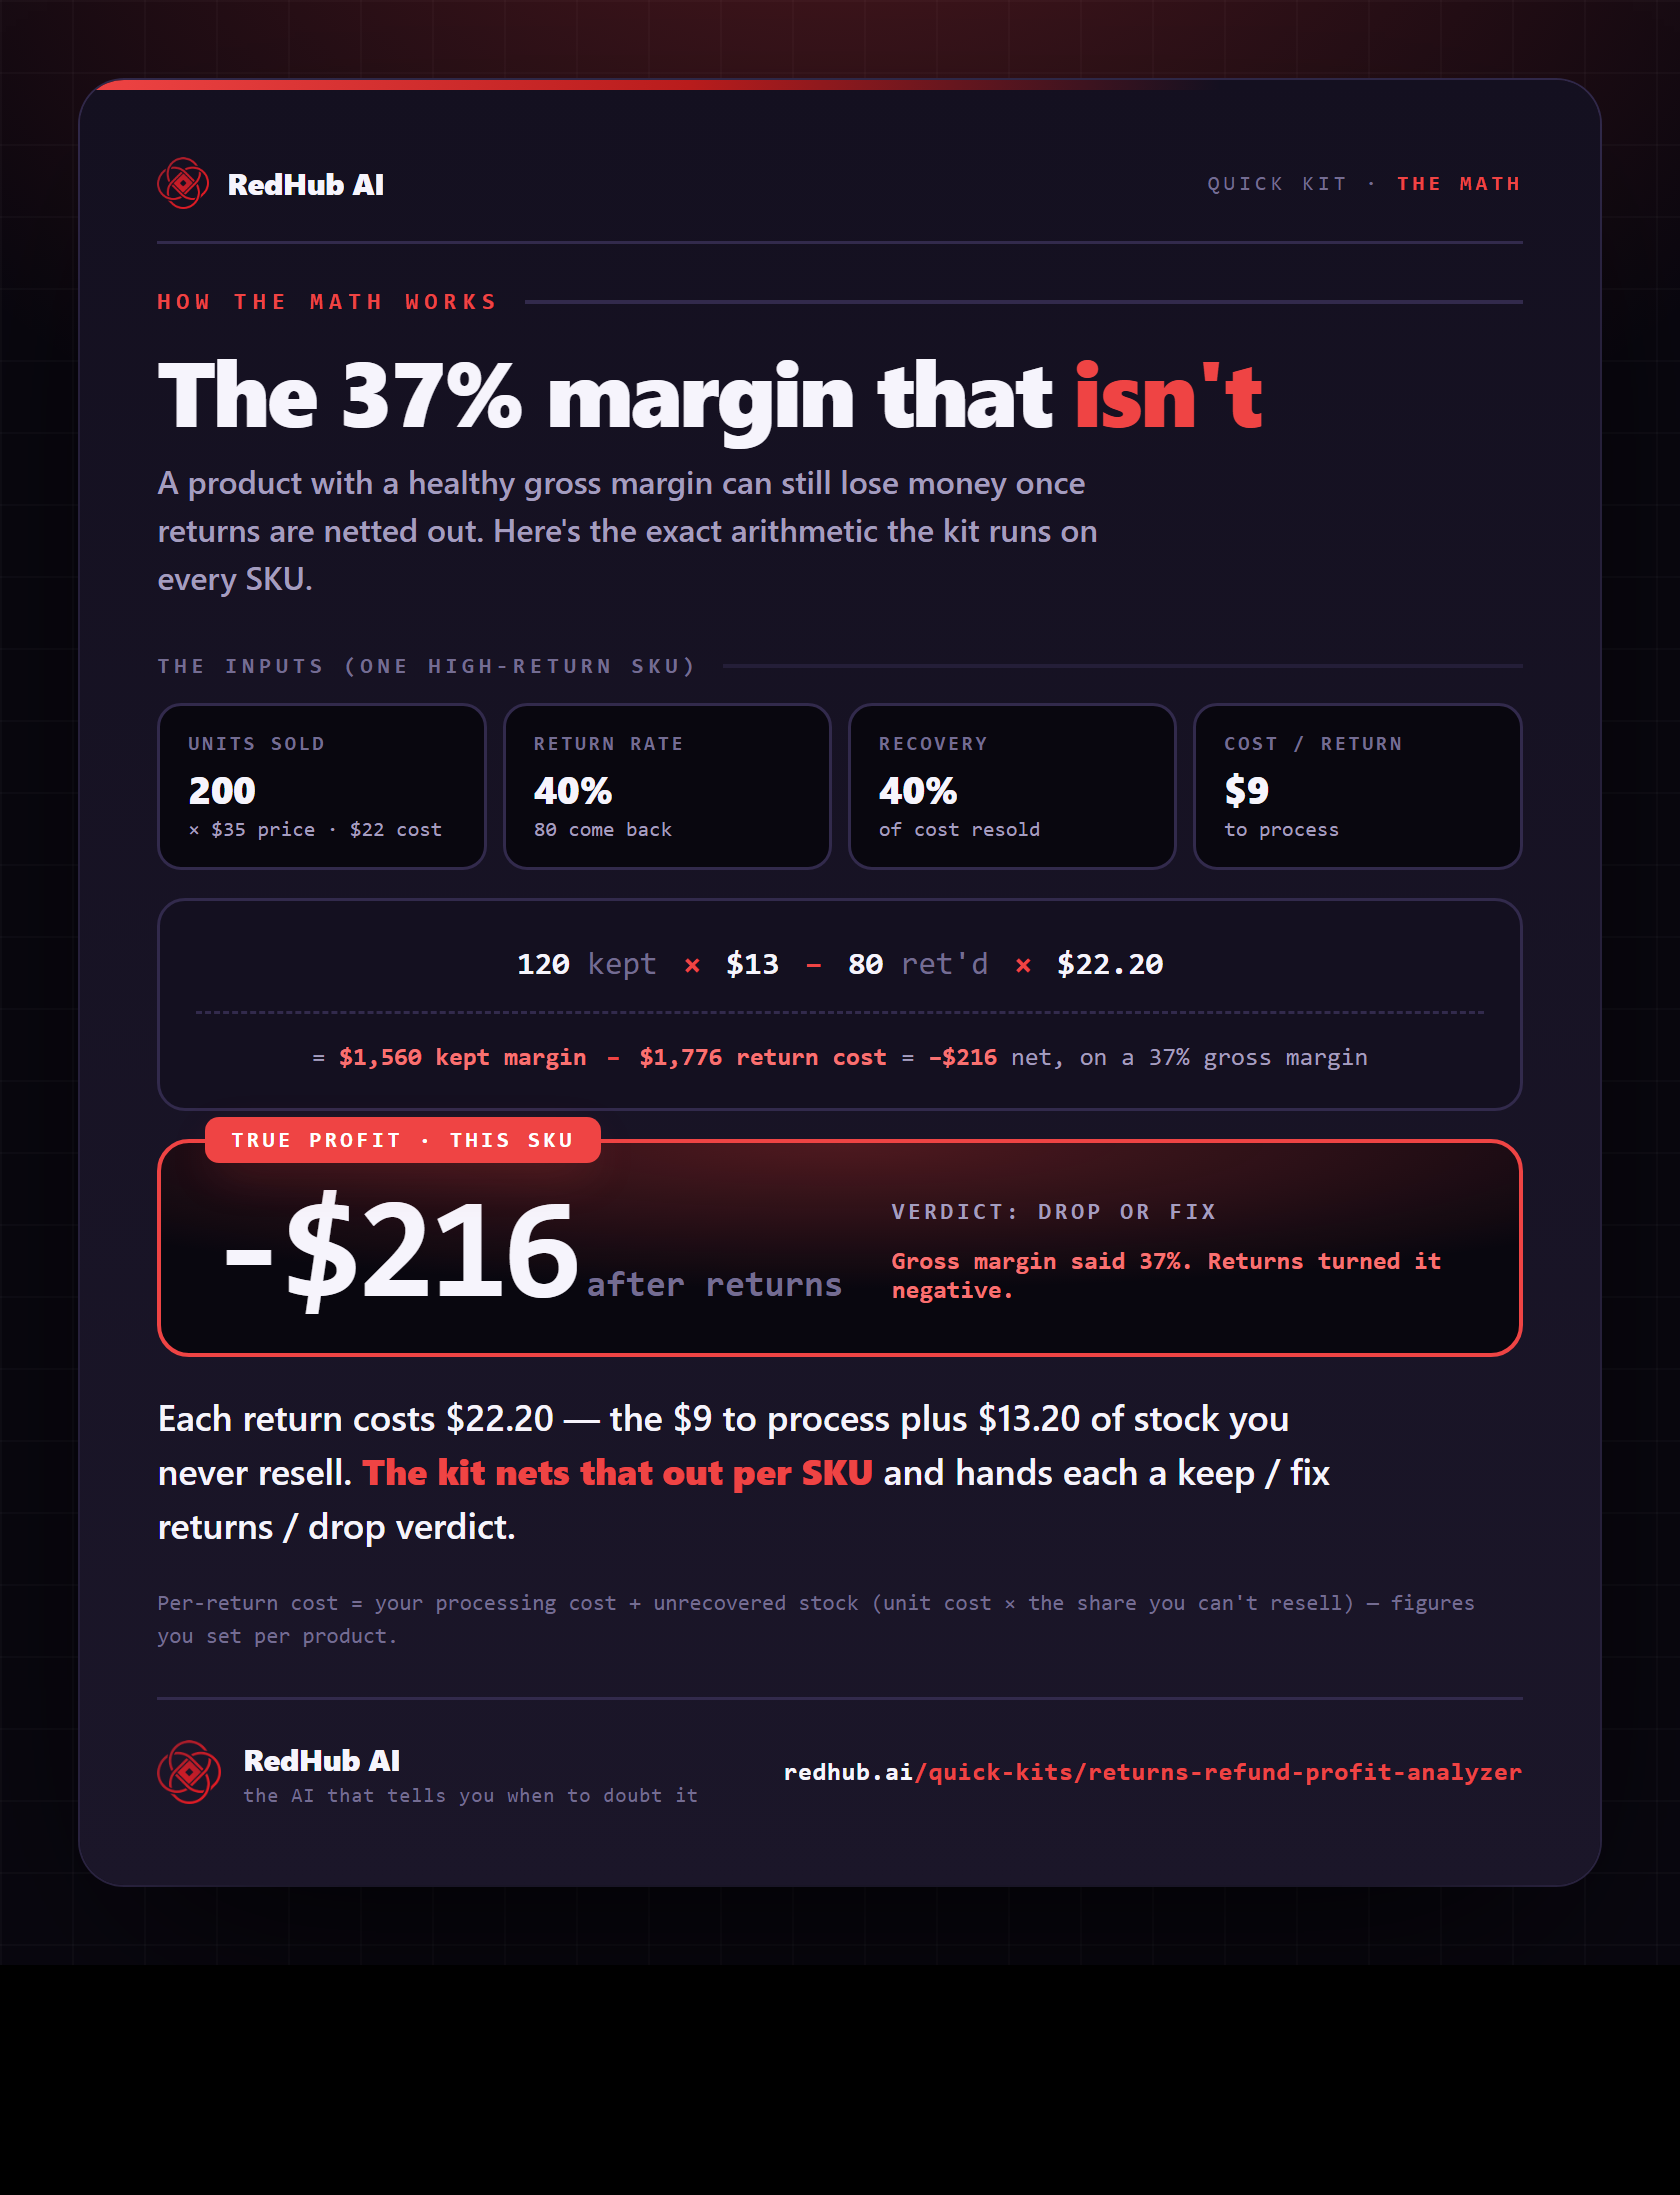
The math behind it, in one image
See the margin after returns: kept-unit margin minus per-return cost — a 37%-margin SKU nets −$216, a drop-or-fix.
See the full calculationWhy it's different
Fix the few that bleed — don't panic
Counts the real cost
Refunded margin, processing, and unrecovered stock — the parts gross margin hides, and the reason a 'good' product can lose money.
Fix before you drop
Zero returns isn't the goal. Most high-return SKUs get a fix-the-listing verdict; dropping is reserved for true money-losers.
A tool, not advice
It does the math on your own numbers and ranks your SKUs. You make the call — it's not a substitute for your accountant.
The sale you celebrate and the return you ignore are the same transaction — only one of them has the full bill.
Who it's for
Clear about the lane. No inflated promises.
Built for you if…
- You sell physical products online — DTC, marketplace, or both
- Your return rate is high enough to worry about (apparel, footwear, accessories)
- You want the true margin per SKU, not just gross margin
- You'd rather fix your worst-returning products than guess at them
Not for you if…
- You sell services or digital products with no physical returns
- You want a live integration with your store rather than a one-time read
- You can't estimate return rate or processing cost even roughly
Pairs well with
Stop the returns leak, then the rest.
Returns are one margin drain. The Profit Leak Finder flags unprofitable accounts, the Discount & Promo Profit Analyzer catches promos that sell at a loss, and the Inventory Cash-Trap Finder frees the cash trapped in stock that won’t move.
Common Questions
The questions ecommerce sellers actually ask before pricing in returns.
It's a one-time spreadsheet for ecommerce sellers that shows the true profit on each product after returns. You enter sales and return details per SKU; it nets out what returns actually cost — the refunded margin, the processing cost, and the inventory you can't resell — and gives each product a verdict: keep, fix returns, or drop-or-fix.
One .xlsx that opens in Microsoft Excel, Google Sheets, or Apple Numbers — no subscription, no login. It's pre-loaded with an eight-product example so it makes sense the moment you open it; clear it and enter your own.
Per product: units sold, price, unit cost, return rate, the cost to process one return, and your recovery rate (how much of a returned item's value you get back by reselling it). Plus one global target return rate. No store or platform integration required.
A return isn't just a refund. The kit adds up the margin you give back on the refunded sale, the cost to process the return, and the inventory value you don't recover when an item can't be resold at full price. That's why a product can show a healthy gross margin and still lose money — in the built-in example, one SKU with a 37% gross margin runs at a small loss once returns are counted.
Dropping a product is the last verdict, not the first. Most high-return products get 'fix returns' — improve the listing, raise recovery, or cut the cost per return before anything drastic. It only flags 'drop or fix' when a product loses money and can't be fixed. It's a decision tool, not financial advice.
The Analyzer is the per-SKU math layer (true margin after returns, keep/fix/drop). The Ecommerce Skills Pack ($89) is the Claude skill layer — six installable skills for Shopify, Amazon, and multi-channel operators covering listings, variants, inventory, and ops. Run the Analyzer to find which SKUs to fix, then use the Pack's listing and ops skills to actually fix them.
Yes — a 30-day money-back guarantee. If it doesn't show you what returns are really costing you, request a refund within 30 days.
Get the kit
See your real margin this afternoon.
Instant download, yours to keep, 12 months of updates. One fixed high-return SKU usually covers it many times over.
- 4-tab .xlsx: returns by SKU, returns map, verdict, action plan
- True-profit-after-returns engine + keep / fix / drop verdict
- Return-cutting playbook + listing, survey, and supplier scripts
- Works in Excel, Google Sheets, or Numbers · 30-day guarantee