Inventory Cash-Trap Finder
For product businesses the cash is usually in the warehouse. This finder shows which SKUs are quietly freezing it — flagging dead and slow stock, totaling what you'd free by right-sizing, and the carrying cost it bleeds every year.
TL;DR
Most carrying-cost tools give you one blended number. This one flags each SKU Dead, Slow, or Healthy and tells you which to liquidate first — so the output is an action list, not a statistic.
instant download · .xlsx · 30-day guarantee
The problem
Profit and cash aren't the same thing. The gap lives on your shelves.
A product business can show a healthy P&L while every dollar of it sits frozen in stock that isn't moving. You can't pay yourself or fund marketing with inventory.
The fix isn't a blended carrying-cost percentage — it's a per-SKU list of what to clear first. Flag the dead and slow stock, size the cash you'd free, and act on the worst offenders.
no sales — the full inventory value is trapped, a liquidation candidate
above your target months on hand — the excess beyond it is trapped cash
typical annual carrying cost of inventory value (capital, storage, risk)
an action list of what to clear — not one vague blended number
Carrying-cost range is a common industry benchmark; the kit estimates from your own inputs and isn't a substitute for your accountant.
What's inside
One sheet. Trapped cash, per SKU.
One .xlsx — open it in Excel, Google Sheets, or Numbers and rank your SKUs today.
Cash-Trap Finder
List every SKU with units on hand, unit cost, and units sold per month; the sheet returns months of stock, inventory value, a Dead / Slow / Healthy status, the trapped cash, and the carrying cost per year — example data filled in, ready to overwrite.
Dashboard
Total trapped cash, the share of inventory it represents, the annual carrying cost on it, and the count of Dead and Slow SKUs — your liquidation case in one screen.
Dead / Slow / Healthy logic
Each SKU is classified against your own target months on hand: Healthy is working capital, Slow has trapped excess beyond the target, Dead is a full-value liquidation candidate.
Start Here
A one-page primer on months-of-stock, what counts as trapped, and how to pick a target and carrying-cost rate you can defend — an action list, not a vague blended percentage.
How it works
Find your trapped cash
Edit the SKUs, set your target months and carrying rate, and watch the trapped-cash total. This is the model from the kit.
| SKU | Units | Unit cost | Sold/mo | Status | Trapped |
|---|---|---|---|---|---|
| Healthy | $0 | ||||
| Slow | $900 | ||||
| Slow | $4,000 | ||||
| Dead | $2,000 | ||||
| Healthy | $0 |
Total trapped cash
$6,900
% of inventory trapped
61%
Carrying cost / yr on trapped
$1,725
1 dead · 2 slow · total inventory value $11,400. Trapped = dead stock plus the excess of slow stock beyond your target months.
This is the live engine. Free the cash stuck on your shelves — spot dead and slow SKUs, size your liquidation, and right-size reorders.
Get the kit — $49Estimates from your inputs; carrying cost commonly runs 20–30%/yr. Not a substitute for your accountant.
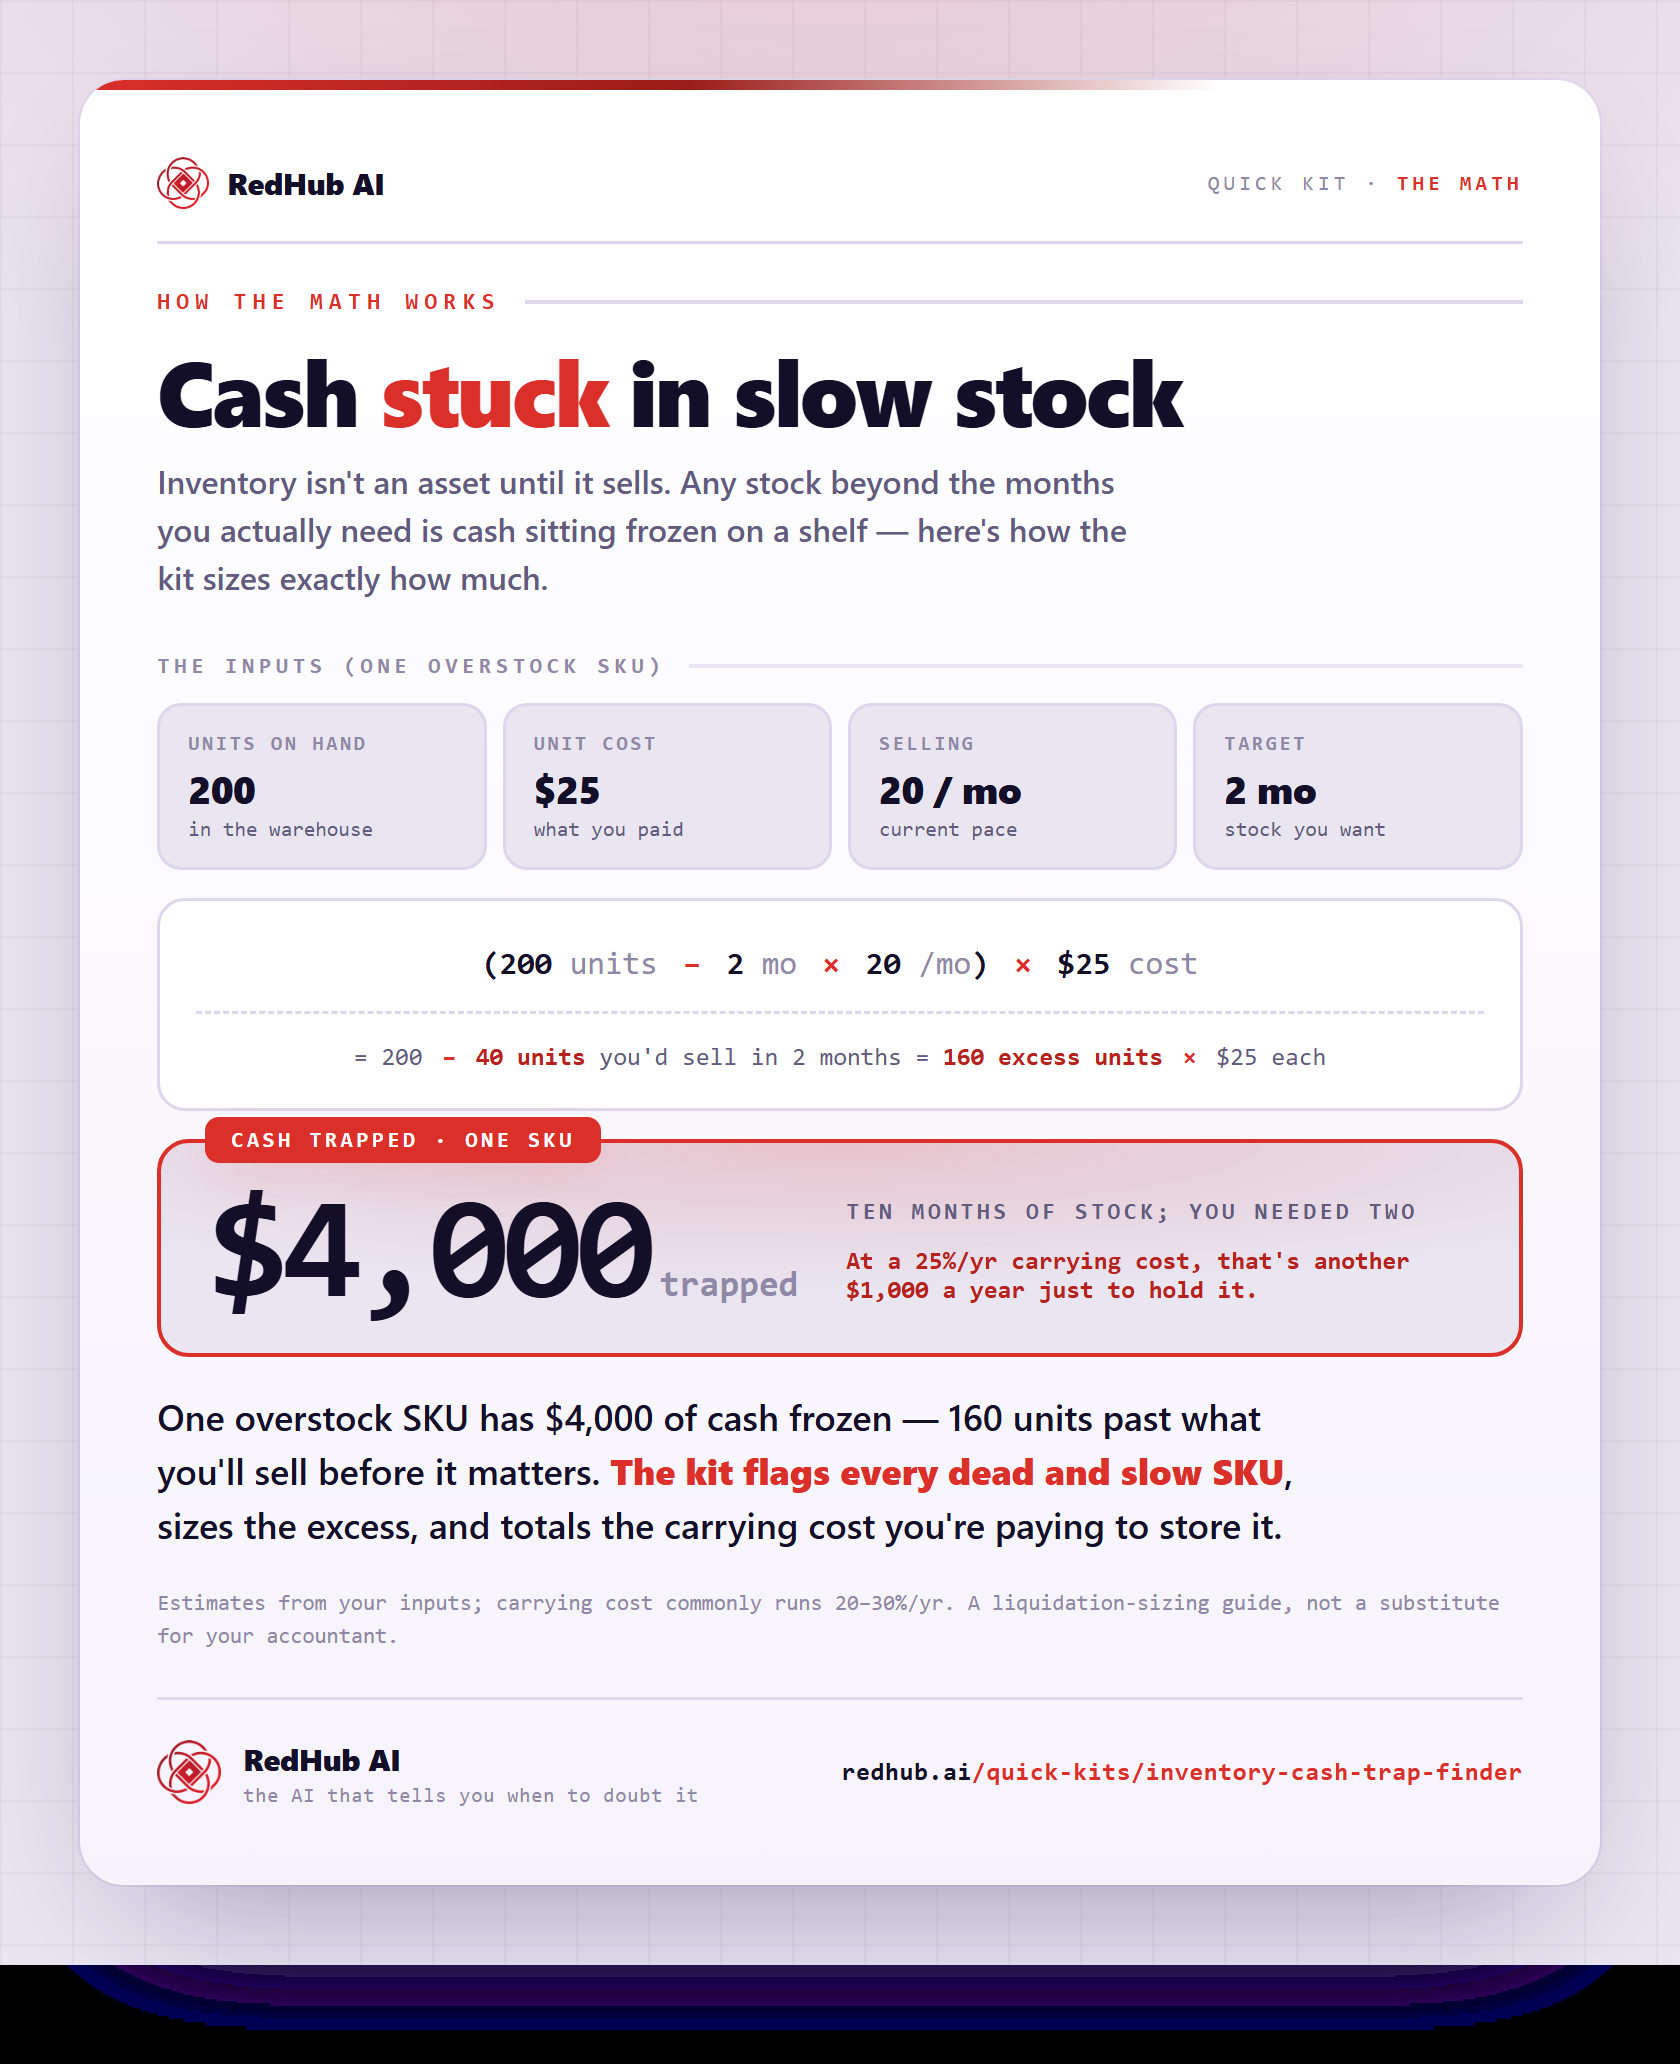
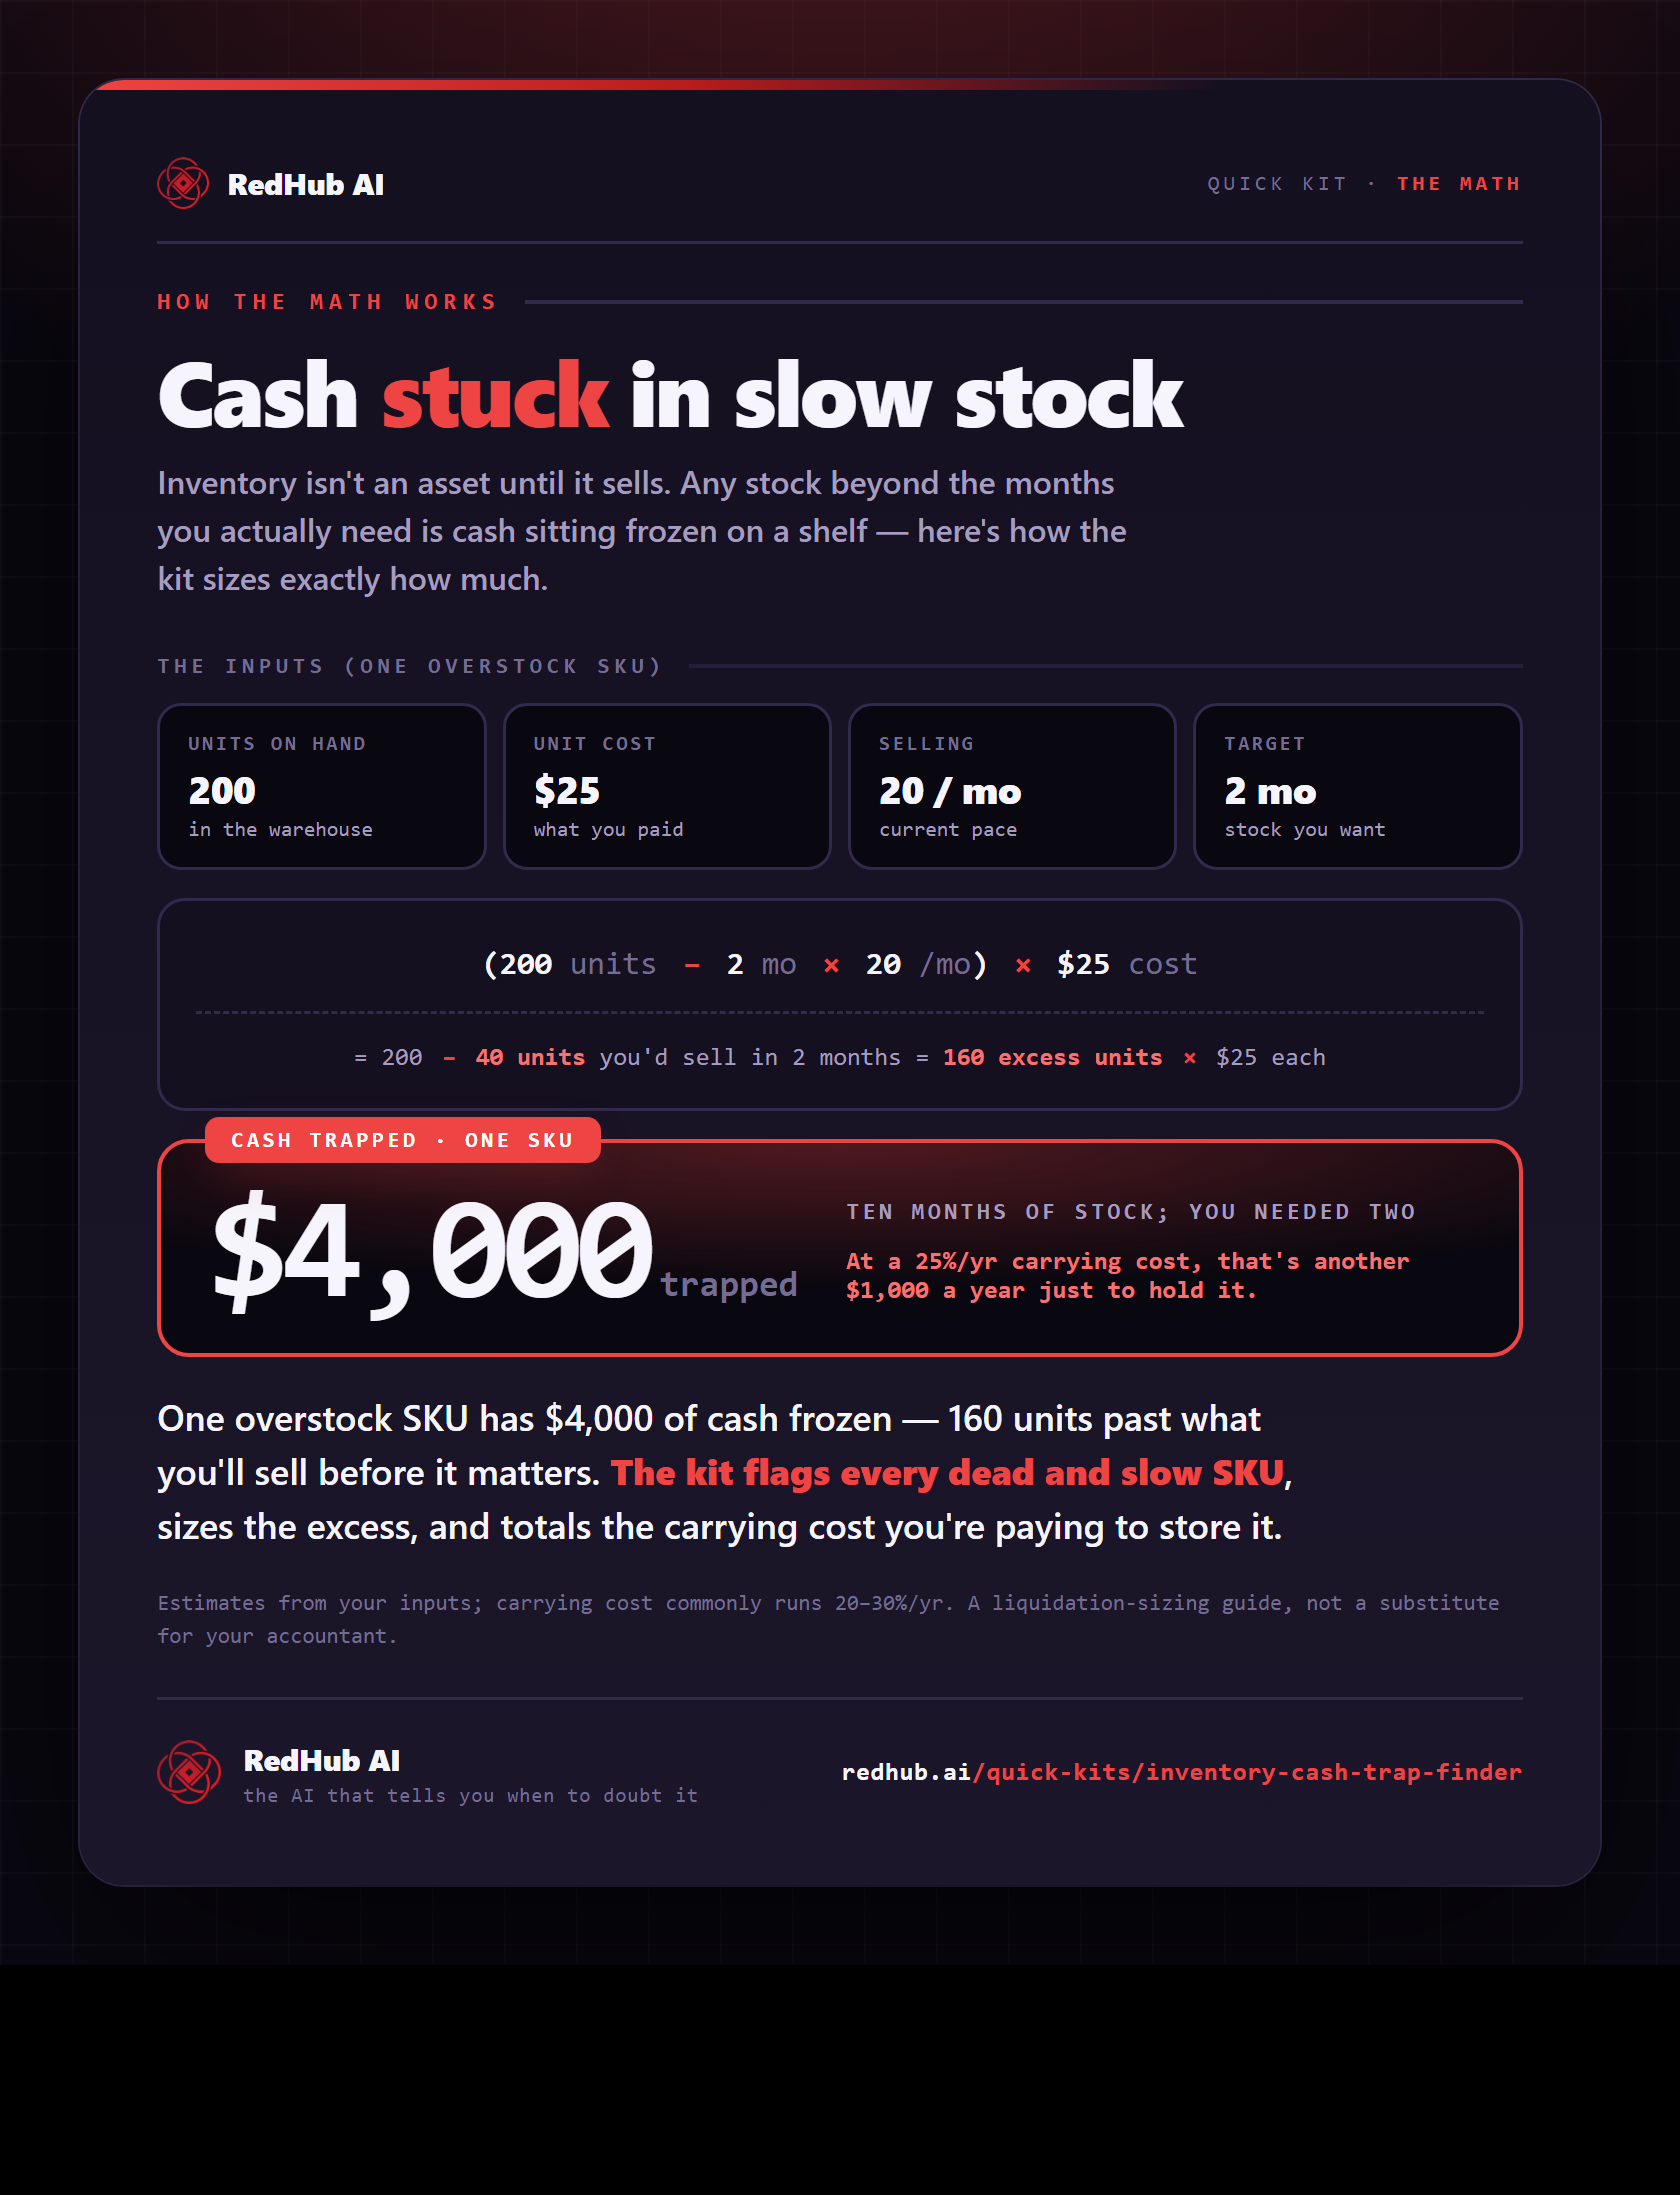
The math behind it, in one image
See the cash frozen in slow stock: (units − target) × unit cost — one overstock SKU has $4,000 trapped, ~$1,000/yr just to hold.
See the full calculationWhy it's different
An action list, not a statistic
Per SKU, not blended
Classifies every SKU against your target months so the dead and slow stock can't hide inside one average carrying-cost number.
Counts only the excess
For Slow SKUs it traps just the stock beyond your target — not the whole value — so the liquidation list is realistic, not alarmist.
Your targets, your call
You set the target months and the carrying-cost rate. It does the math on your numbers; you decide what to clear.
Cash trapped in dead stock isn't a rounding error — it's the marketing budget, the payroll cushion, and the runway you keep saying you don't have.
Keep it from recurring with the Ecommerce Skills Pack, the Manufacturing & Distribution Ops Pack, and the Finance & Reporting Automation Kit.
Who it's for
Clear about the lane. No inflated promises.
Built for you if…
- You hold physical stock — ecommerce, retail, wholesale, or distribution
- Growth has outpaced cash and you suspect it's stuck in slow SKUs
- You can pull units on hand, unit cost, and units sold per month
- You want a per-SKU liquidation list, not a blended percentage
Not for you if…
- You want a live integration that syncs stock from your IMS automatically
- You don't track units sold per SKU even roughly
- You need demand forecasting and reorder-point automation, not a fast audit
Common Questions
The questions operators actually ask before they clear stock.
An interactive spreadsheet (a Quick Kit) that finds the cash tied up in slow-moving and dead stock. You list each SKU with units on hand, unit cost, and units sold per month; it flags every SKU Healthy, Slow, or Dead, totals the cash you'd free by right-sizing, and estimates the carrying cost that inventory bleeds each year.
Months of stock = units on hand ÷ units sold per month. A SKU at or under your target months is Healthy (cash is working). Above it is Slow — and the excess beyond the target is counted as trapped. A SKU with no sales is Dead, so its full value is trapped and it's a liquidation candidate. You set the target months and the annual carrying-cost rate.
Because profit and cash aren't the same thing. Plenty of product businesses look profitable on paper while every dollar is frozen in a warehouse — they can't pay themselves or fund marketing. This finder surfaces exactly where the cash is stuck so you can free it before it becomes a crisis.
Carrying cost — capital tied up, storage, service, and risk (shrinkage, obsolescence) — typically runs 20–30% of inventory value per year, per industry benchmarking. The kit defaults to 25% and lets you change it. It's an estimate from your inputs, not a substitute for your accountant or an inventory system.
Ecommerce brands, retailers, wholesalers, and manufacturers/distributors — anyone holding physical stock. It's most valuable when growth has outpaced cash and you suspect too much capital is sitting in slow SKUs.
A single polished spreadsheet (.xlsx) with three tabs: Start Here, a Dashboard, and the per-SKU Cash-Trap Finder (works in Excel, Google Sheets, or Numbers). Once you see the trapped cash, the Ecommerce and Manufacturing/Distribution Ops packs and the Finance & Reporting kit help you right-size reorders and keep it from recurring. One-time purchase, lifetime access plus 12 months of updates.
Get the kit
Turn shelf space back into cash.
Instant download, yours to keep, 12 months of updates. Clearing one dead SKU usually covers it many times over.
- 3-tab .xlsx: Start Here, Dashboard, Cash-Trap Finder
- Per-SKU Dead / Slow / Healthy + trapped cash + carrying cost
- Total trapped cash and the liquidation list, in one screen
- Works in Excel, Google Sheets, or Numbers · 30-day guarantee