The Math · How it works
Cash stuck in slow stock
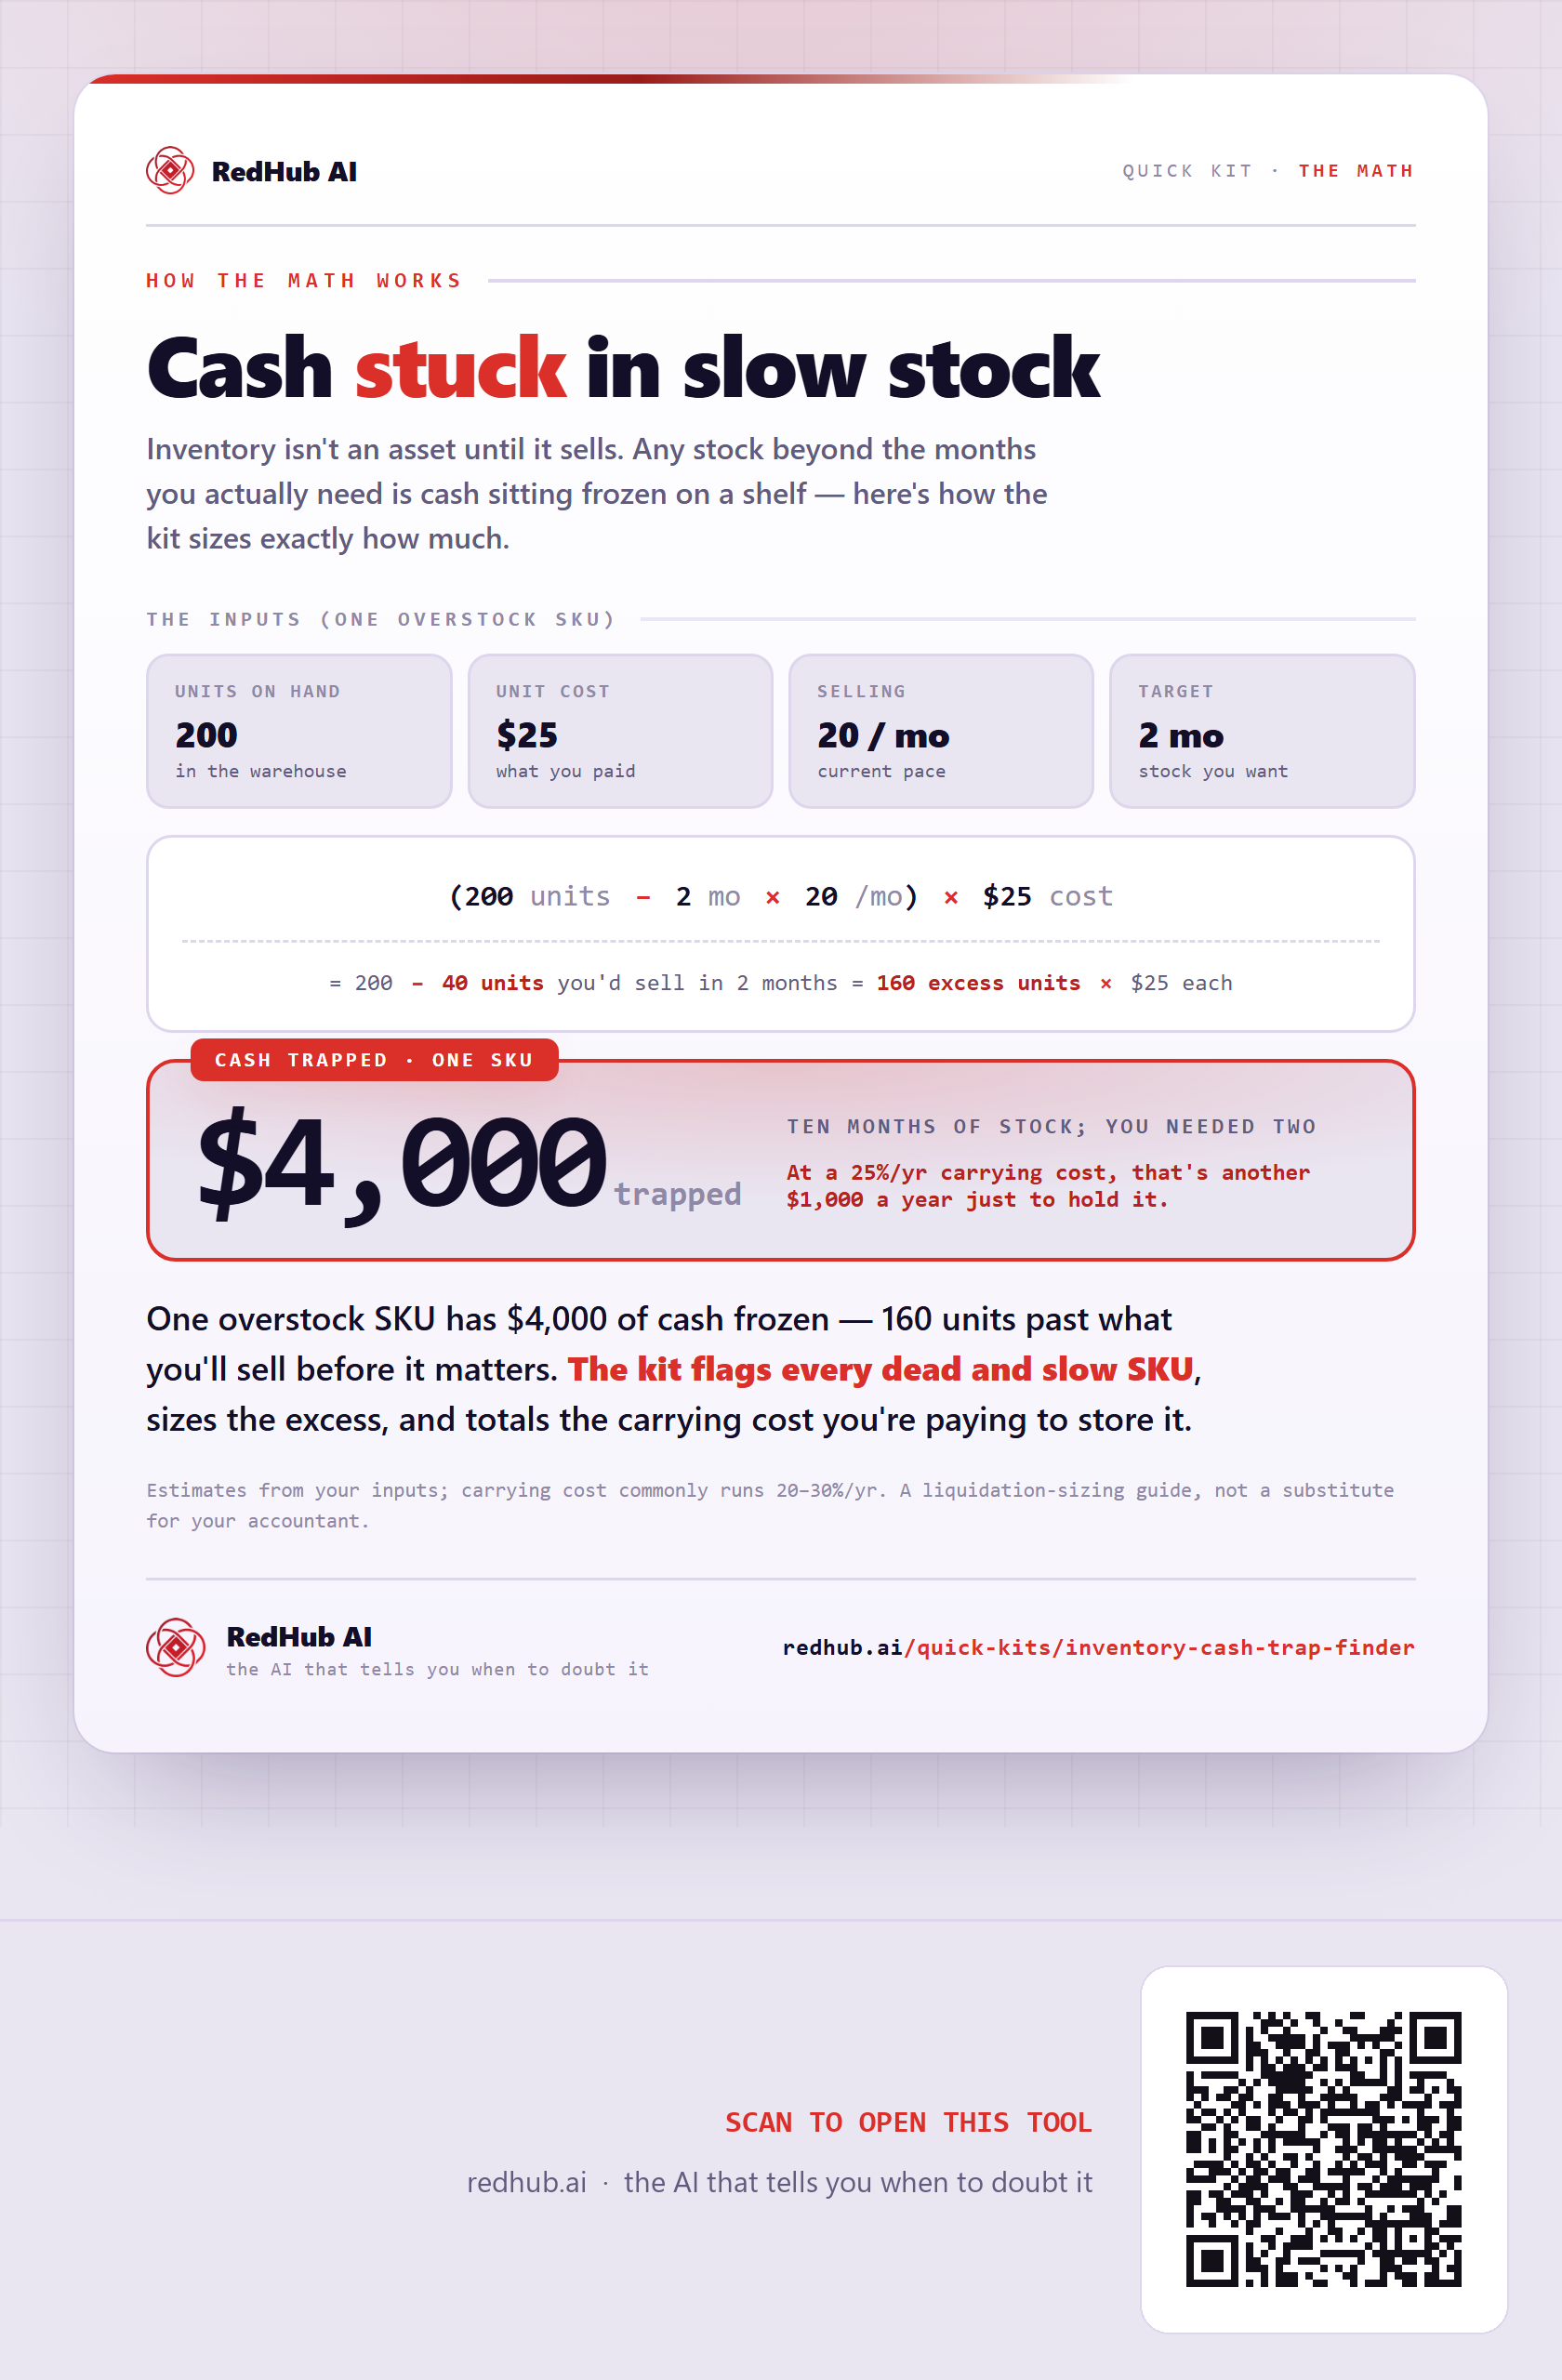
Inventory isn't cash until it sells. One overstock SKU — 10 months of stock when you need 2 — has $4,000 frozen on the shelf. The finder flags every dead and slow SKU and totals the trapped cash plus the carrying cost to hold it.
Embed this diagram
Free to share and embed with attribution (CC BY 4.0) — keep the link to redhub.ai.
Interactive — renders the live diagram
<iframe src="https://redhub.ai/visuals/kit/inventory-cash-trap-finder.html" title="Cash stuck in slow stock — the math — RedHub AI" width="760" height="1251" loading="lazy" style="border:0;width:100%;max-width:760px"></iframe>
<p style="font:14px/1.5 system-ui,sans-serif"><a href="https://redhub.ai/visuals/kit/inventory-cash-trap-finder">Cash stuck in slow stock — the math</a> — by <a href="https://redhub.ai">RedHub AI</a>, the AI that tells you when to doubt it.</p>
Image + link — a static picture for any blog
<a href="https://redhub.ai/visuals/kit/inventory-cash-trap-finder"><img src="https://redhub.ai/visuals/kit/inventory-cash-trap-finder-share.png" alt="Worked example: an overstock SKU (200 units, $25 cost, selling 20/mo, 2-month target) has $4,000 in trapped cash." width="760" loading="lazy" style="max-width:100%;height:auto;border-radius:16px"></a>
<p style="font:14px/1.5 system-ui,sans-serif"><a href="https://redhub.ai">RedHub AI</a> — the AI that tells you when to doubt it.</p>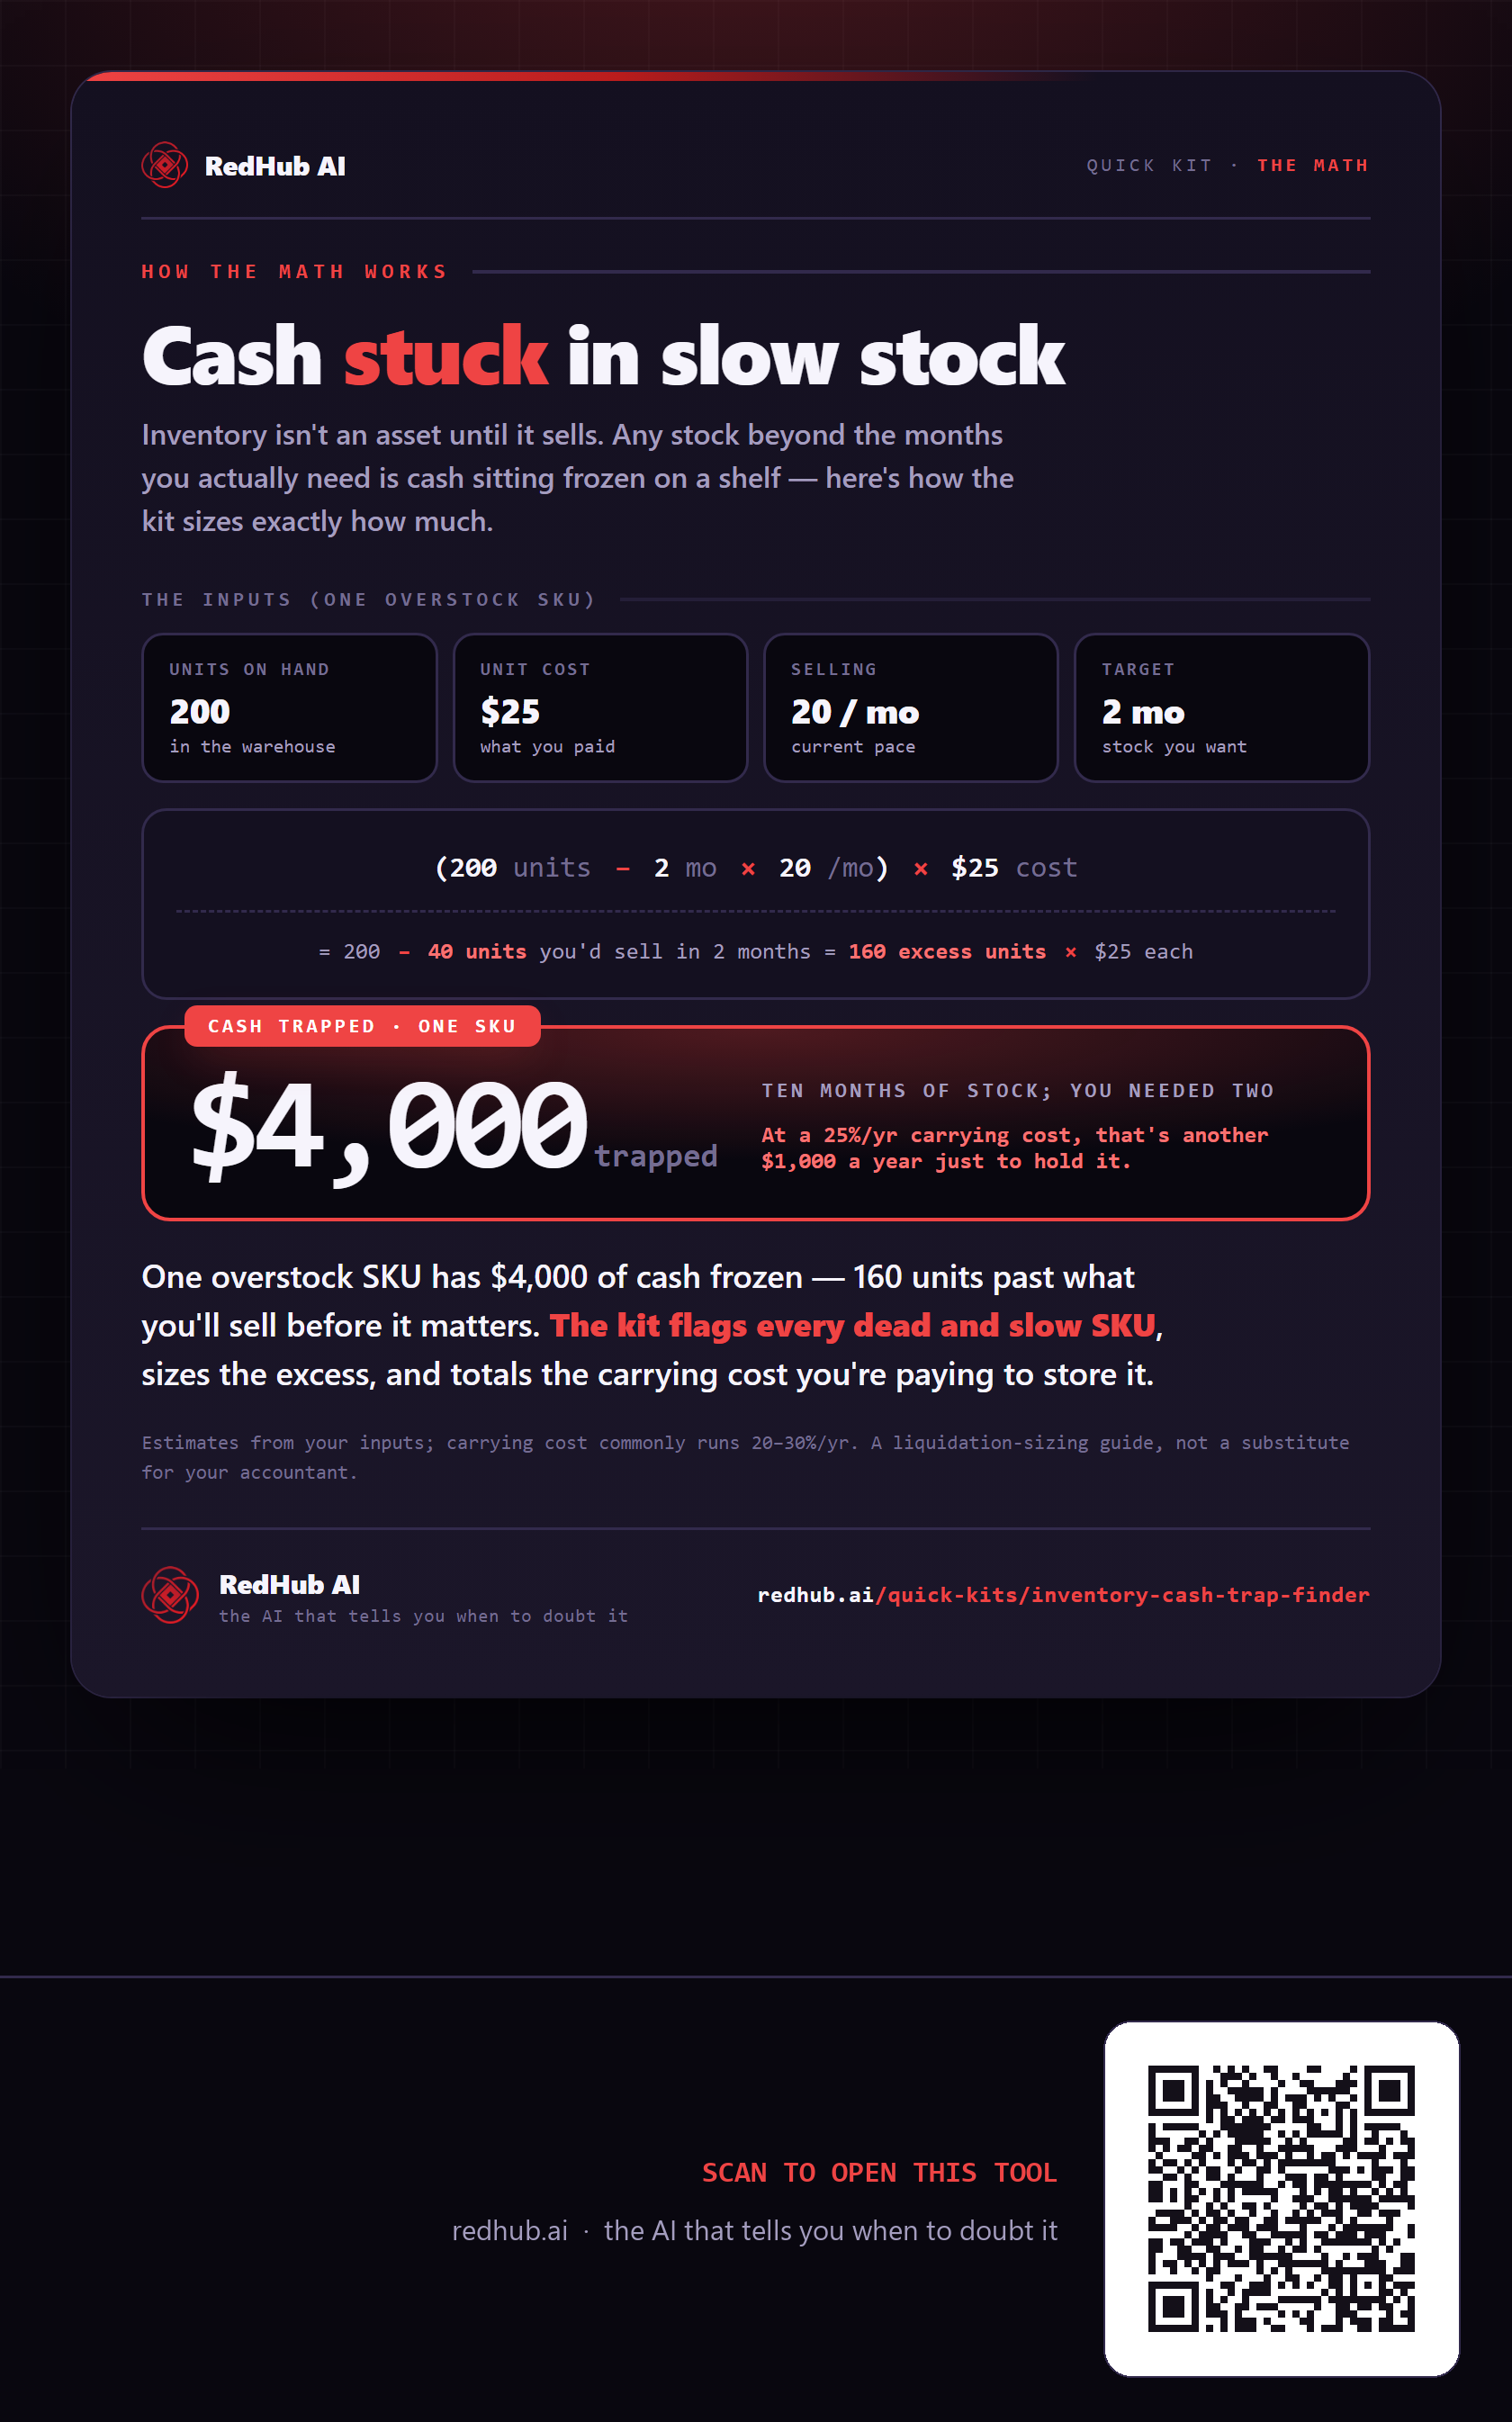
This is the math behind Inventory Cash-Trap Finder. More diagrams in the Visual Field Guide.