Discount & Promo Profit Analyzer
See the true margin on every discount — incremental vs cannibalized — and which promos to keep, limit, or kill. Revenue isn't profit.
TL;DR
Every discount handed to a customer who'd have bought anyway is pure lost margin. This kit prices it. In the example, a “20% off” sitewide event nets −$6,000 ($8,000 handed to full-price buyers) while a targeted new-customer code nets +$6,200.
instant download · .xlsx · 30-day guarantee
The problem
Discounts feel like growth. Then profit's flat and no one can say why.
A sale lifts revenue, so it feels like a win. But most of that discount goes to customers who would have bought at full price — and every one of those dollars is margin you simply gave away.
Price each promo against the alternative of running none at all, and the picture sharpens: the discounts that reach genuinely new demand earn their keep, and the ones that just subsidize existing demand quietly bleed margin.
net margin on the example's 'sitewide 20% off' event
of that discount handed to buyers who'd have paid full price
net on a targeted new-customer code — same store
your honest estimate of new demand — the input that decides it all
Example figures are computed live from the workbook's seeded sample promos — not a claim about any real store.
What's inside
One sheet. The real margin on every discount.
One .xlsx — open it in Excel, Google Sheets, or Numbers and price your promos today.
Promos tab
List each discount, coupon, or sale. Enter units, discount %, regular price, unit cost, and incremental %; the sheet returns net margin versus no promo and a verdict for each — example data filled in, ready to overwrite.
Promo Margin Dashboard
Net margin across all promos, margin from your Keep promos, margin lost to Kill promos, and the standout line — the total discount you handed to full-price buyers, the quiet cost no dashboard shows you.
The verdict
Every promo gets one of three calls — Keep, Limit, or Kill — from its net margin and how incremental it really was. Net-negative promos are tinted red.
Incremental-vs-cannibalized model
A transparent, editable formula that separates new demand from sales you'd have made anyway — the distinction that turns 'revenue up' into 'profit down or up,' stated honestly.
How the verdict works
Net vs no-promo, then the call
Net margin is the discounted margin on every unit, minus the full margin you'd have earned on the units that would have sold anyway. That number — and how incremental the promo really was — sets the verdict:
- Keep — added margin overall — the new sales more than paid for the discount
- Limit — net-negative but high-incremental — keep it tighter, at a lower discount
- Kill — net-negative and mostly cannibalized — stop or rework it
The built-in example · 4 promos
Two profitable promos, one to tighten, one to kill — and a five-figure line nobody usually sees.
Try it
Price each promo against running none at all
Net margin vs no promo
$1,790
Margin handed to full-price buyers
$13,460
Keep / Limit / Kill
2 / 1 / 1
Promos analyzed
4
This is the live engine. Your numbers here reset when you reload. The kit saves every promo, separates incremental from cannibalized demand, and totals exactly how much discount you handed to customers who'd have paid full price.
Get the kit — $39| Promo | Units | Disc % | Price | COGS | Incr % | Net vs none | Verdict |
|---|---|---|---|---|---|---|---|
| $6,200 | Keep | ||||||
| -$6,000 | Kill | ||||||
| -$1,950 | Limit | ||||||
| $3,540 | Keep |
The “incremental %” is your estimate and drives the result. Gross margin only — ignores brand, acquisition, and lifetime effects. A margin-leak guide, not attribution or accounting.
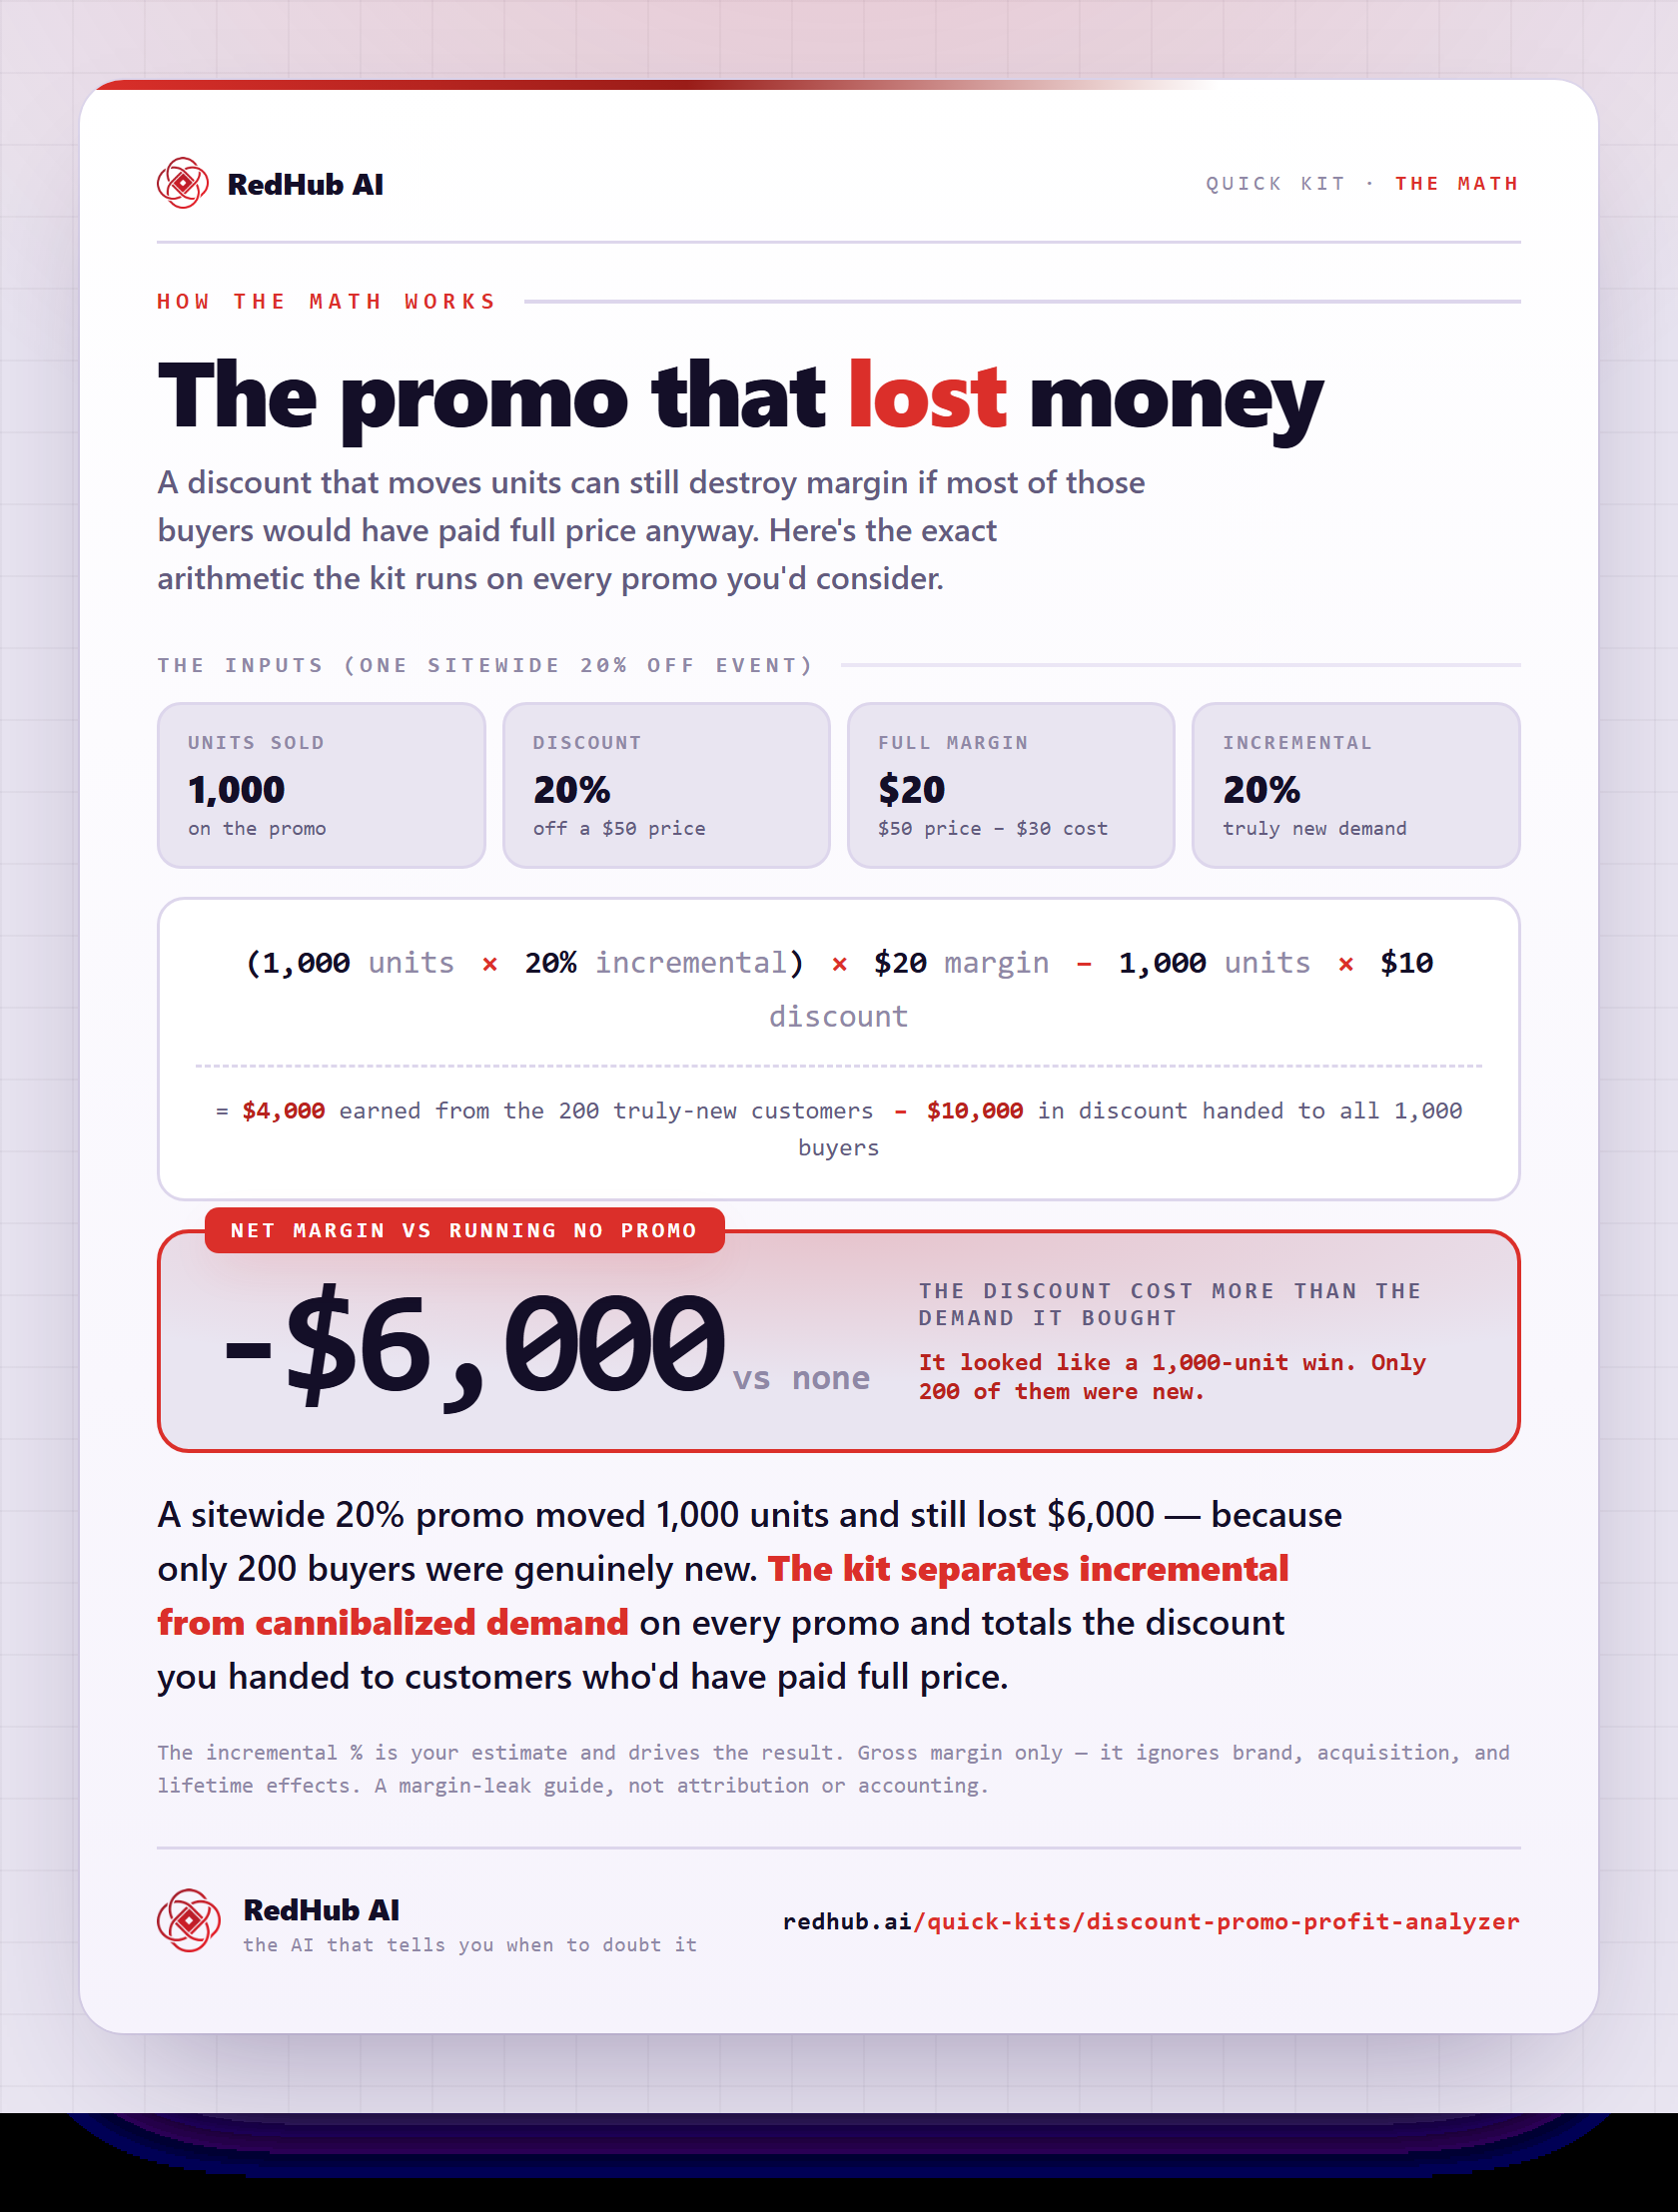
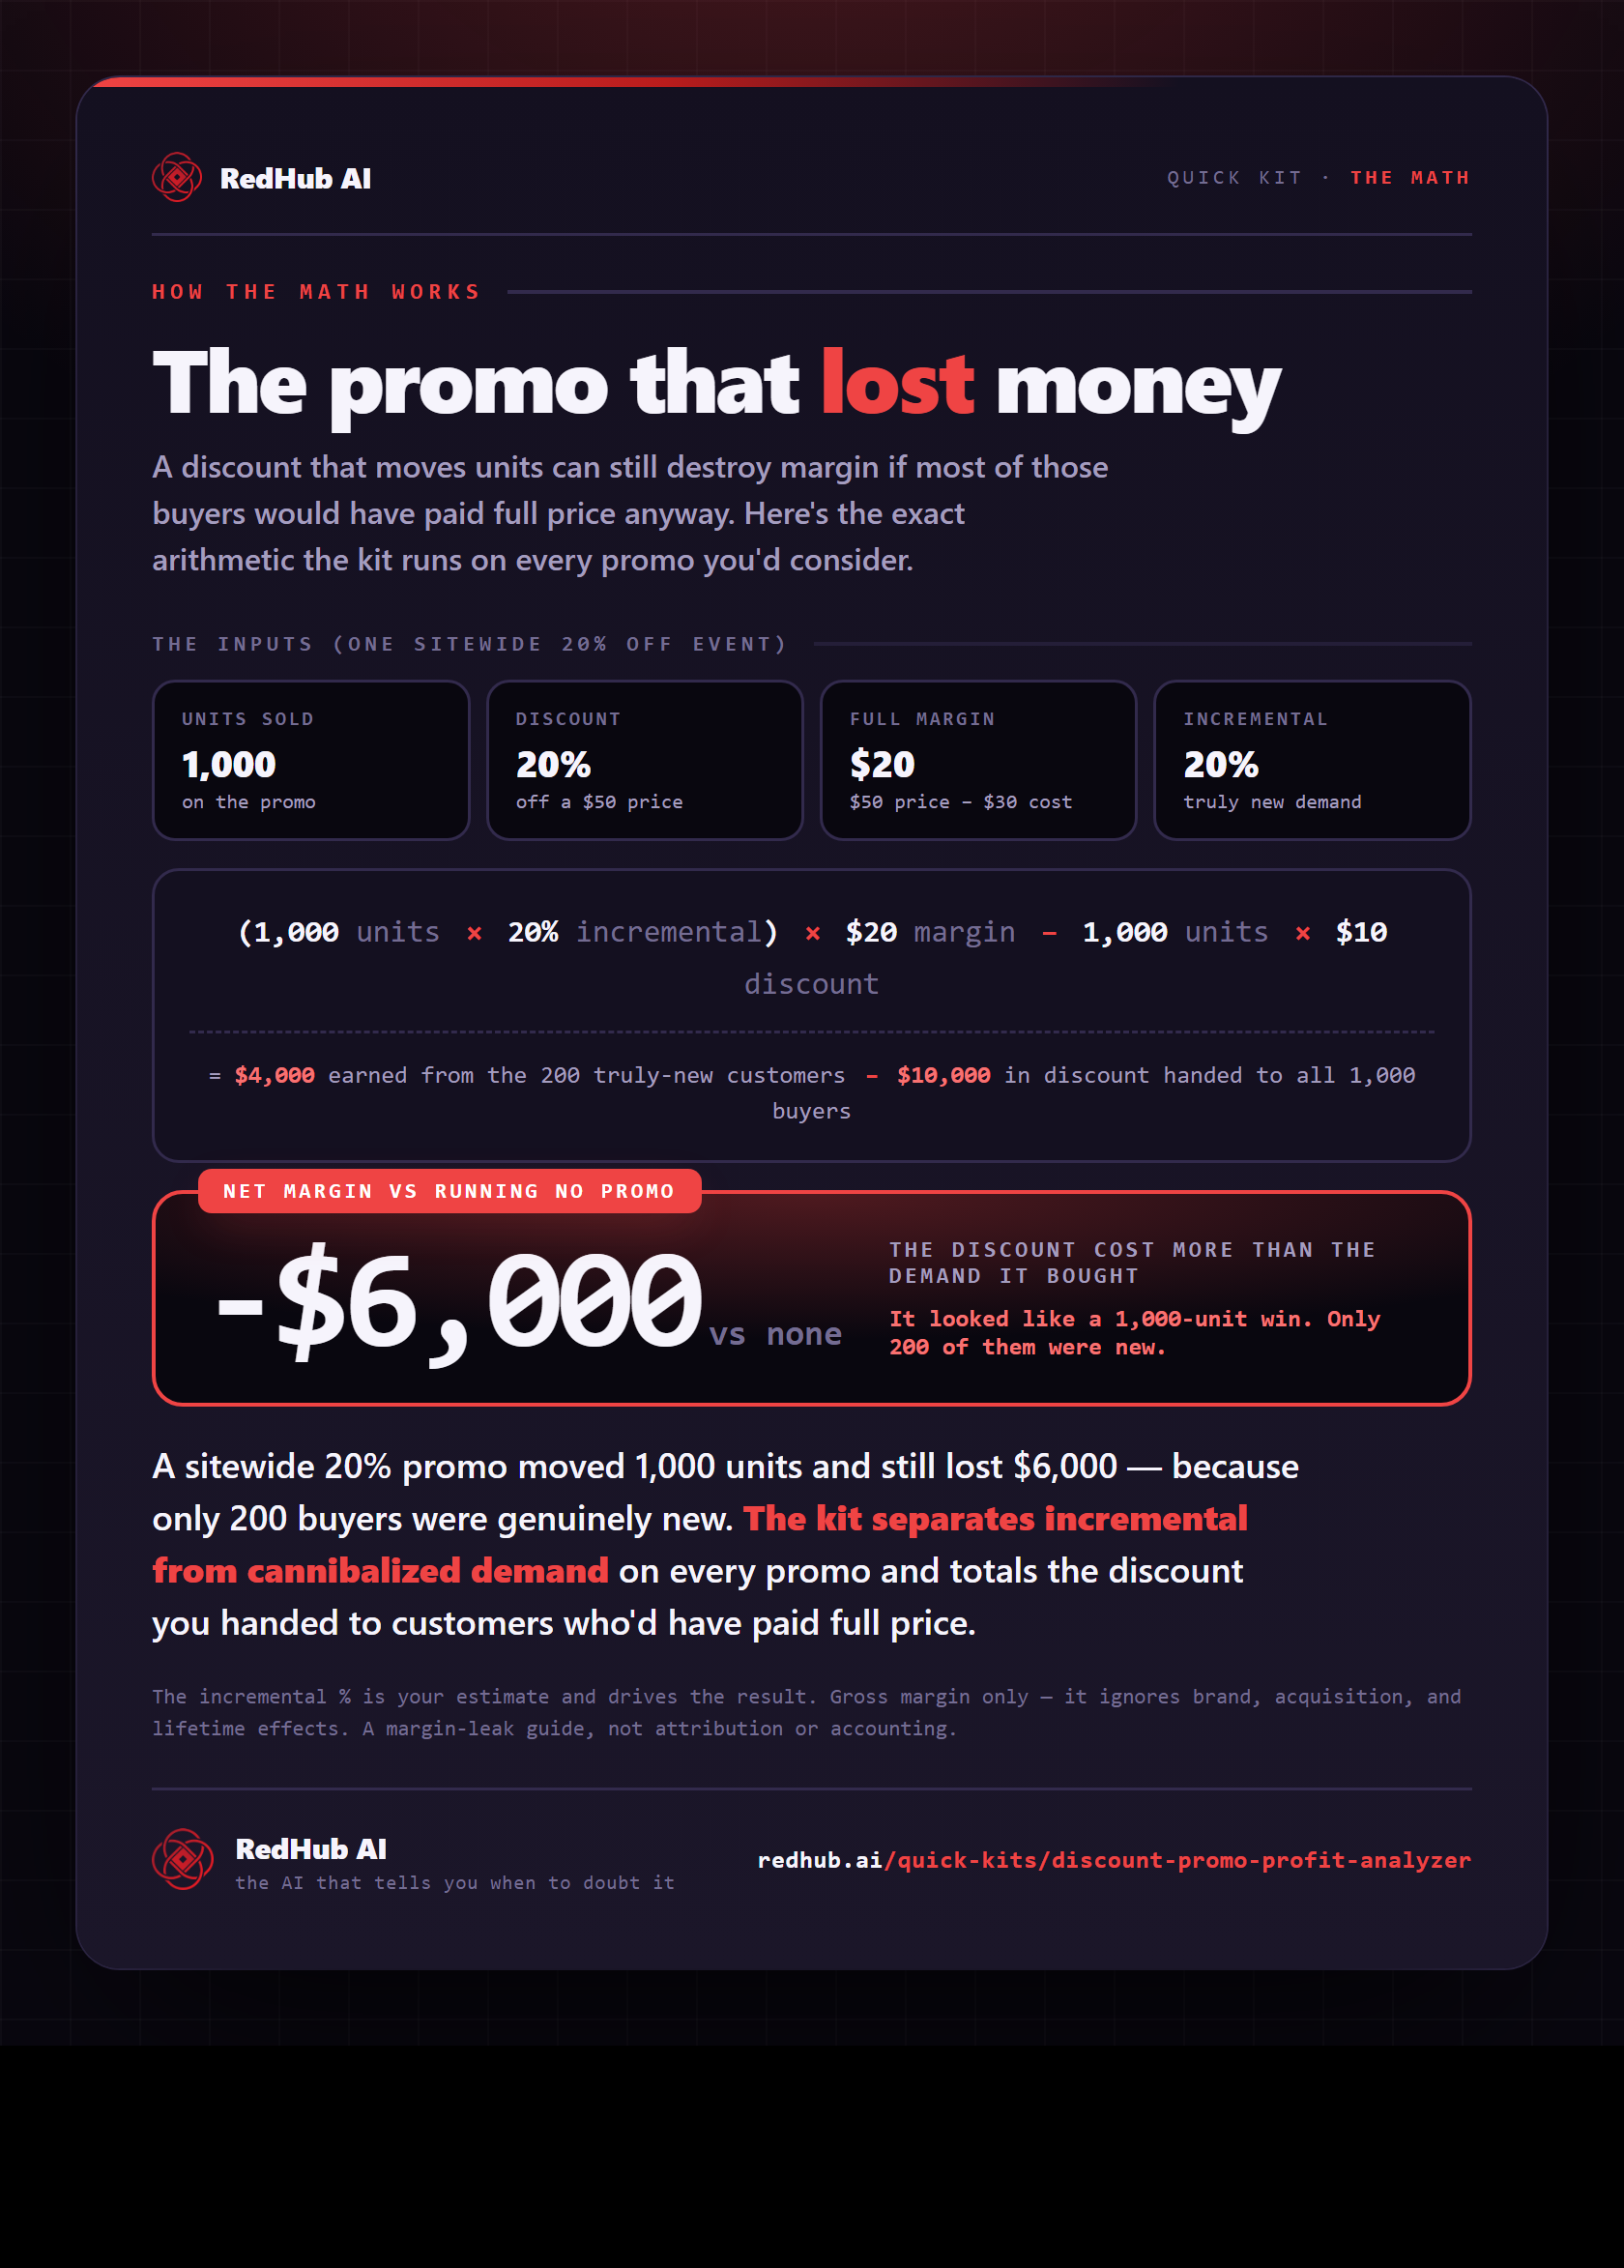
The math behind it, in one image
See the promo math after cannibalization: a sitewide 20% off that moves 1,000 units still nets −$6,000 vs no promo — a Kill.
See the full calculationWhy it's different
Prices the discount you give away
Counts cannibalization
Separates new demand from the sales you'd have made anyway — the distinction that turns 'revenue up' into the real profit story.
Limit before you kill
A high-incremental promo that's net-negative isn't a failure — it's a discount set too deep. The verdict says tighten, not cancel.
A tool, not advice
It does the math on your own numbers and your own incremental estimate. It measures gross margin, not brand or lifetime value — you make the call.
The sale boosted revenue. Whether it boosted profit depends entirely on who you discounted — and most of them would have paid full price.
Who it's for
Clear about the lane. No inflated promises.
Built for you if…
- You run discounts, coupons, or sales and want the real margin on each
- You sell physical or digital products with a known unit cost
- You can estimate, honestly, how much of a promo's demand was truly new
- You'd rather tighten a leaky promo than cancel a working one
Not for you if…
- You want a full marketing-attribution model with brand and lifetime value
- You can't estimate incremental demand even roughly
- You need audited accounting, not a fast margin read
Pairs well with
Price the promo, then find the other leaks.
Promos are one place margin leaks. The Profit Leak Finder flags unprofitable accounts, the Returns & Refund Profit Analyzer catches the returns quietly erasing profit, and Should I Raise My Prices? tests whether the list price should move at all.
Common Questions
The questions sellers actually ask before running the next sale.
It's a one-time spreadsheet that prices every discount or promo against running no promo at all. You enter units, discount %, regular price, unit cost, and your honest estimate of how many of those sales were truly incremental; it computes net margin versus baseline, gives a keep / limit / kill verdict per promo, and totals how much discount you handed to customers who'd have paid full price.
One .xlsx that opens in Microsoft Excel, Google Sheets, or Apple Numbers — no subscription, no login. It ships with a worked example so it makes sense immediately; overwrite it with your own promos.
It's your estimate of the share of promo sales that genuinely wouldn't have happened without the discount. It drives everything: the rest are cannibalized sales — customers who'd have paid full price — and every dollar of discount handed to them is pure lost margin. Be honest and conservative; the verdict is only as good as this input.
Because revenue and margin aren't the same. In the built-in example, a 'sitewide 20% off' event nets −$6,000 — $8,000 of the discount went to people who'd have bought anyway — while a targeted new-customer code nets +$6,200. Same store, opposite outcomes, because one promo reached new demand and the other discounted existing demand.
Keep = the promo added margin overall. Limit = net-negative but it brought real new demand (high incremental %), so it's worth keeping in a tighter, lower-discount form. Kill = net-negative and mostly cannibalized — stop it or rework it.
It completes the margin-truth set: the Returns & Refund Profit Analyzer finds margin lost to returns, Should I Raise My Prices tests headroom, and this prices your discounts. Returns and discounts are the two quiet margin leaks in ecommerce — this is the discount half.
Yes — a 30-day money-back guarantee. If it doesn't change how you think about your next promo, request a refund within 30 days.
Get the kit
Price your next promo before you run it.
Instant download, yours to keep, 12 months of updates. Catching one margin-negative promo usually covers it many times over.
- 3-tab .xlsx: Start Here, Promos, Margin Dashboard
- Net-vs-no-promo engine + keep / limit / kill verdict
- The 'margin handed to full-price buyers' line, totaled for you
- Works in Excel, Google Sheets, or Numbers · 30-day guarantee