Profit Leak Finder
Rank every client by true profit — after the cost to serve them — and find the ones quietly losing you money. Often the busy ones, not the small ones.
TL;DR
Revenue isn't profit. Once you subtract the hours you spend servicing each client, the picture changes — a few accounts carry the book and a tail bleeds it. This kit shows the leak, the concentration, and a keep / reprice / fix / fire verdict per client. The example finds $5,500/yr leaking and a $30k client running at a loss.
instant download · .xlsx · 30-day guarantee
The problem
Your biggest client might be your least profitable.
Most businesses track revenue per client and stop there. But the client who pays well and also eats every meeting, every revision, and every “quick question” can cost more to serve than they bring in — and nobody notices, because the invoice still looks healthy.
Add up the cost to serve and a clear shape appears: a handful of clients make almost all your profit, while a quiet tail erases a chunk of it.
of total profit can come from your top 20% of clients
of profit is often eroded by the bottom 20% of clients
of profit comes from just 3 clients in the built-in example
client in the example runs at a loss — on servicing hours alone
Source: the “whale curve” of customer profitability (top-20% / bottom-20% profit concentration), Lakeridge.
What's inside
Four tabs, one honest read on your book.
One .xlsx — open it in Excel, Google Sheets, or Numbers and see your book today.
Client Profitability
List each client's revenue, direct cost, and the hours you spend servicing them. Set one blended cost-per-hour and a target margin, and the sheet returns true profit, margin, and a verdict per client.
Profit Map
A profit-per-client chart that reads as a whale curve once sorted — a few big earners, a flat middle, and a tail dipping below zero — plus the recoverable leak, your top-3 concentration, and the count of unprofitable accounts.
The verdict
Every client gets one of four calls — keep, reprice, fix cost-to-serve, or fire-or-reprice — driven by their margin and how much of it servicing eats. Colour-coded, with the losers tinted red.
Action Plan & scripts
The order to act in (reprice, then fix scope, fire last) plus copy-paste scripts: a renewal reprice, a scope-tightening note, a graceful offboarding, and AI prompts to decide one account or estimate its cost to serve.
How the verdict works
Margin, and what eats it
True profit is revenue minus direct cost minus the cost to serve (your servicing hours × your cost per hour). Each client's margin and servicing share set the verdict:
- Keep — margin at or above your target — these carry the book
- Reprice — profitable but thin — the price is too low for the value
- Fix cost to serve — thin because servicing eats it — tighten scope first
- Fire or reprice — losing money — reprice hard, or let them go gracefully
The built-in example · 10 clients
Healthy revenue, 240 servicing hours, negative profit — exactly the leak this finds.
Try it
Find your profit leak
Total profit / yr
$128,750
Profit leaking
$2,000
Blended margin
37%
Top 3 share of profit
95%
This is the live engine. Your numbers here reset when you reload. The kit saves your whole client book, charts profit by client, and gives you the reprice / fix-cost-to-serve / fire script behind each verdict.
Get the kit — $49| Client | Revenue/yr | Direct cost | Svc hrs | Profit | Verdict |
|---|---|---|---|---|---|
| $65,000 | Keep | ||||
| $38,750 | Keep | ||||
| $18,500 | Keep | ||||
| $6,500 | Reprice | ||||
| $2,000 | Fix cost to serve | ||||
| -$2,000 | Fire or reprice |
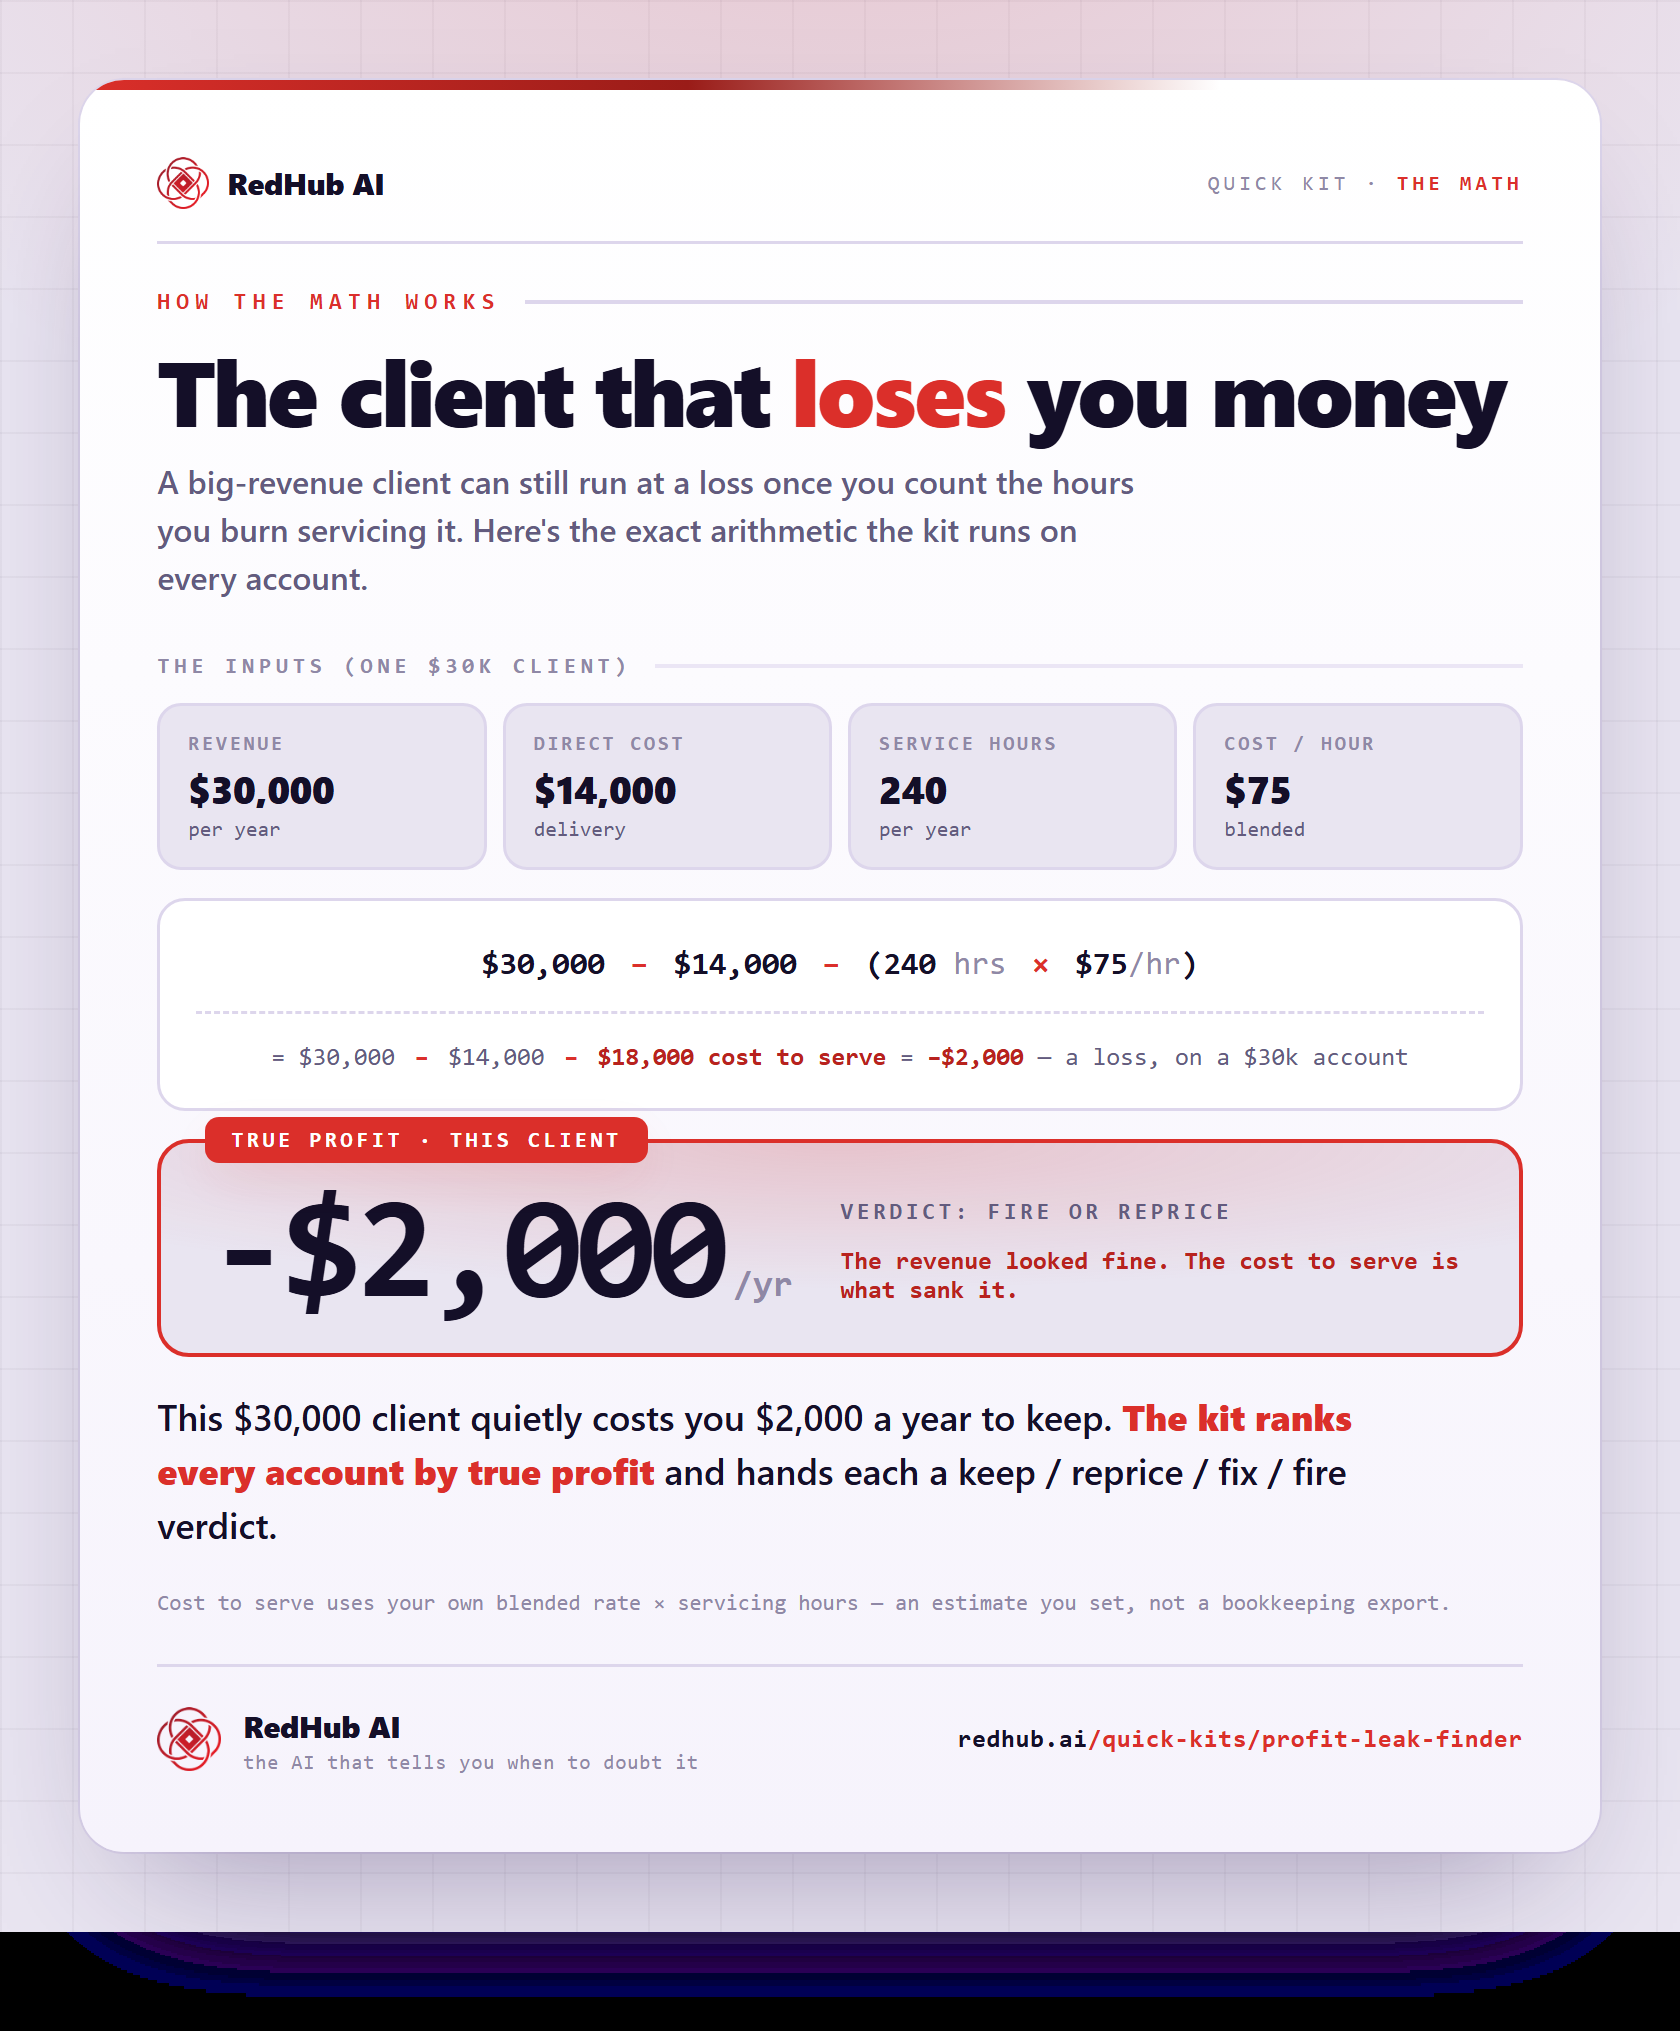
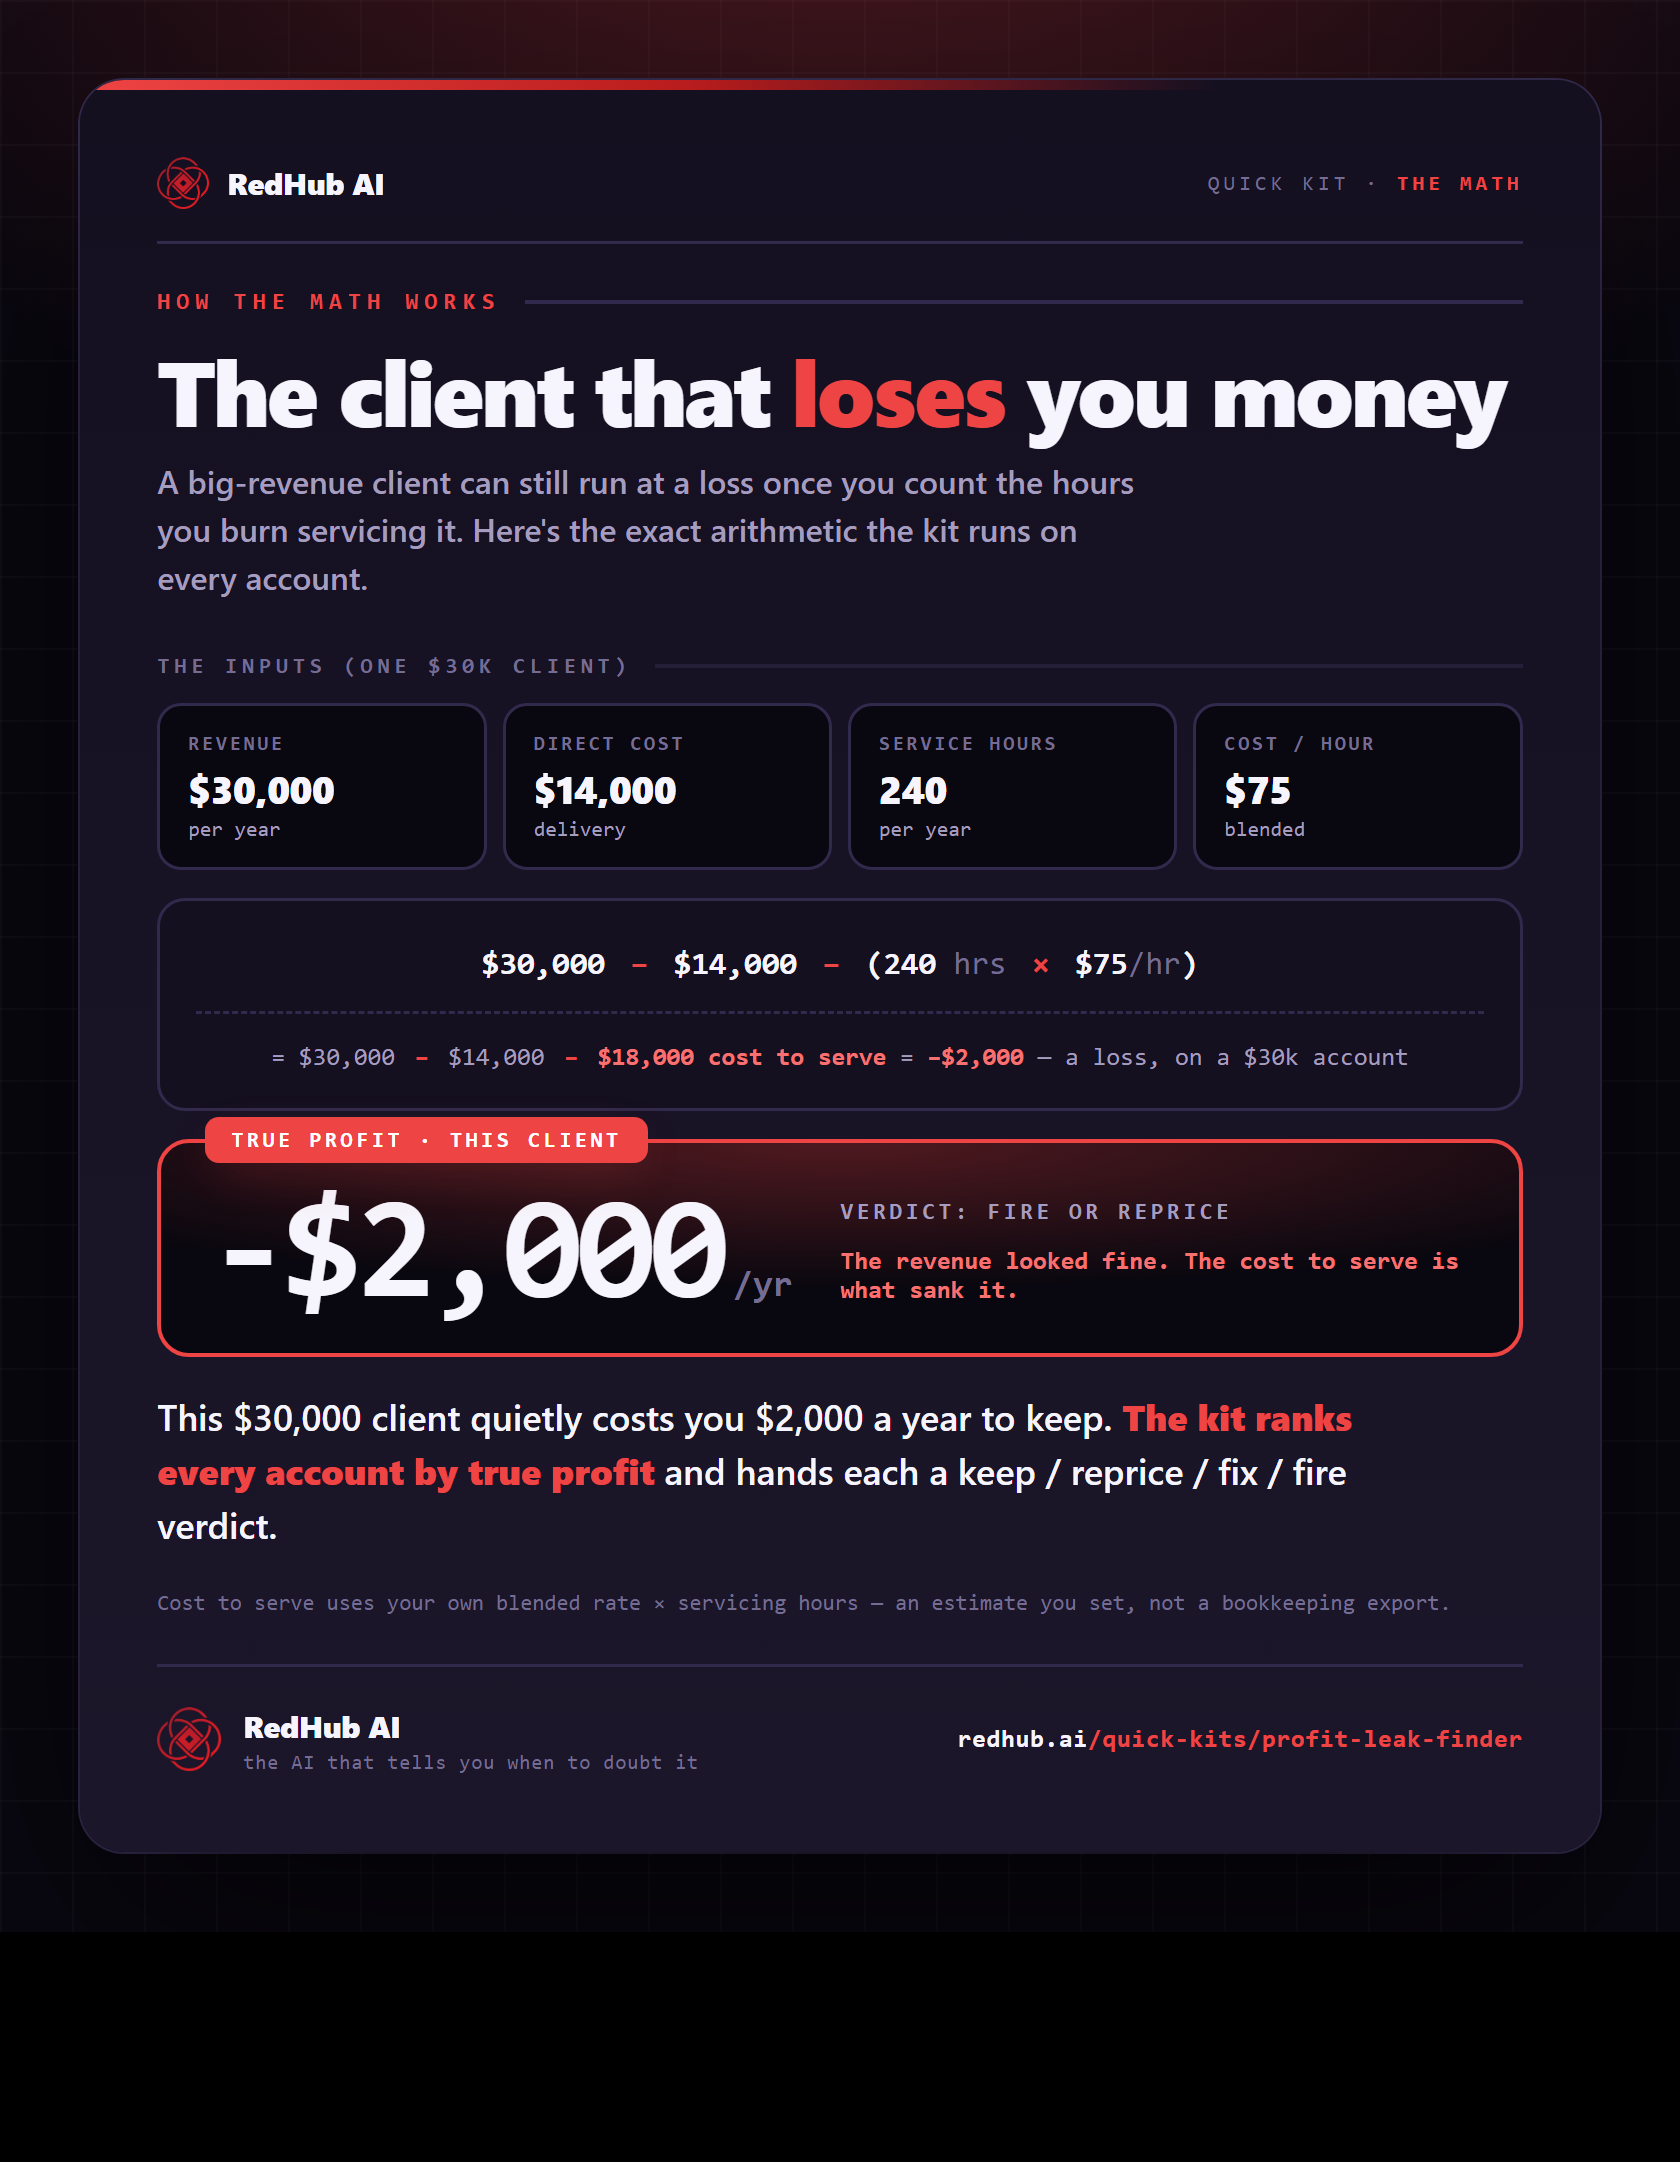
The math behind it, in one image
See the true profit on a client: revenue − direct cost − service hours × rate — a $30k client nets −$2,000, a fire-or-reprice.
See the full calculationWhy it's different
Fix and reprice before you fire
Counts the cost to serve
It surfaces the servicing hours that simple revenue reports hide — the real reason a healthy-looking client loses money.
Firing is last, not first
Most thin accounts get a reprice or scope fix. The kit only reaches for fire when a client loses money and won't move.
A tool, not advice
It does the math and ranks your book on your own numbers. You make the call — it's not a substitute for your accountant.
The client who never says no to you is often the one you're paying to keep.
Who it's for
Clear about the lane. No inflated promises.
Built for you if…
- You run an agency, consultancy, or service business with a handful to a few dozen clients
- You bill for time or retainers and suspect some accounts aren't worth it
- You want to know which clients to protect, reprice, or let go
- You'd rather see the cost to serve than fly on revenue alone
Not for you if…
- You have thousands of transactional customers (this is built for named accounts)
- You can't estimate servicing hours per client at all
- You want automated time-tracking rather than a one-time read
Pairs well with
Find the leak, then fix the book.
Once you know which accounts bleed margin, the Should I Raise My Prices? kit runs the increase scenarios on the clients worth keeping, the Churn-Save Offer Decision Kit settles save-or-release on the marginal ones with the margin math, and the Accounts Receivable Recovery Kit collects what the keepers already owe you.
Common Questions
The questions agency and consultancy owners actually ask before fixing their book.
It's a one-time spreadsheet that ranks every client by true profit — revenue minus the full cost to serve them — so you can see which clients actually make you money. It flags the unprofitable ones and gives each a verdict: keep, reprice, fix cost-to-serve, or fire-or-reprice.
One .xlsx that opens in Microsoft Excel, Google Sheets, or Apple Numbers — no subscription, no login. It's pre-loaded with a ten-client example so it makes sense the moment you open it; clear it and enter your own.
Per client: revenue, direct cost, and roughly how many hours a year you spend servicing them. Plus two global settings — your blended cost per servicing hour and your target margin. No accounting export or bookkeeping project required.
It's the hidden cost of looking after a client — support, revisions, meetings, scope creep, slow payment — that simple revenue and direct cost both miss. It's the reason a big-revenue client can still lose you money. In the built-in example, a $30,000 client runs at a loss because it soaks up 240 servicing hours a year.
No. Firing is the last verdict, not the first. The kit points most thin accounts to reprice or to fix the cost to serve, and only flags fire-or-reprice when a client loses money and won't move. It's a decision tool, not financial advice — the call is yours.
The Planner tells you whether you have capacity to take work; the Profit Leak Finder tells you whether the work you have is worth keeping. Run them back to back: find the unprofitable accounts here, fix or fire them, then check the Planner to see if the freed-up hours need filling, hiring against, or letting recover. Two halves of the same agency-decision loop.
Yes — a 30-day money-back guarantee. If it doesn't show you where your profit is leaking, request a refund within 30 days.
Get the kit
See your real book this afternoon.
Instant download, yours to keep, 12 months of updates. One repriced account usually covers it for good.
- 4-tab .xlsx: client profitability, profit map, verdict, action plan
- Cost-to-serve engine + keep / reprice / fix / fire verdict per client
- Copy-paste reprice, scope-fix, and graceful-offboarding scripts
- Works in Excel, Google Sheets, or Numbers · 30-day guarantee