Tool Gate · How it works
How the Cash-Flow Sentinel gate works
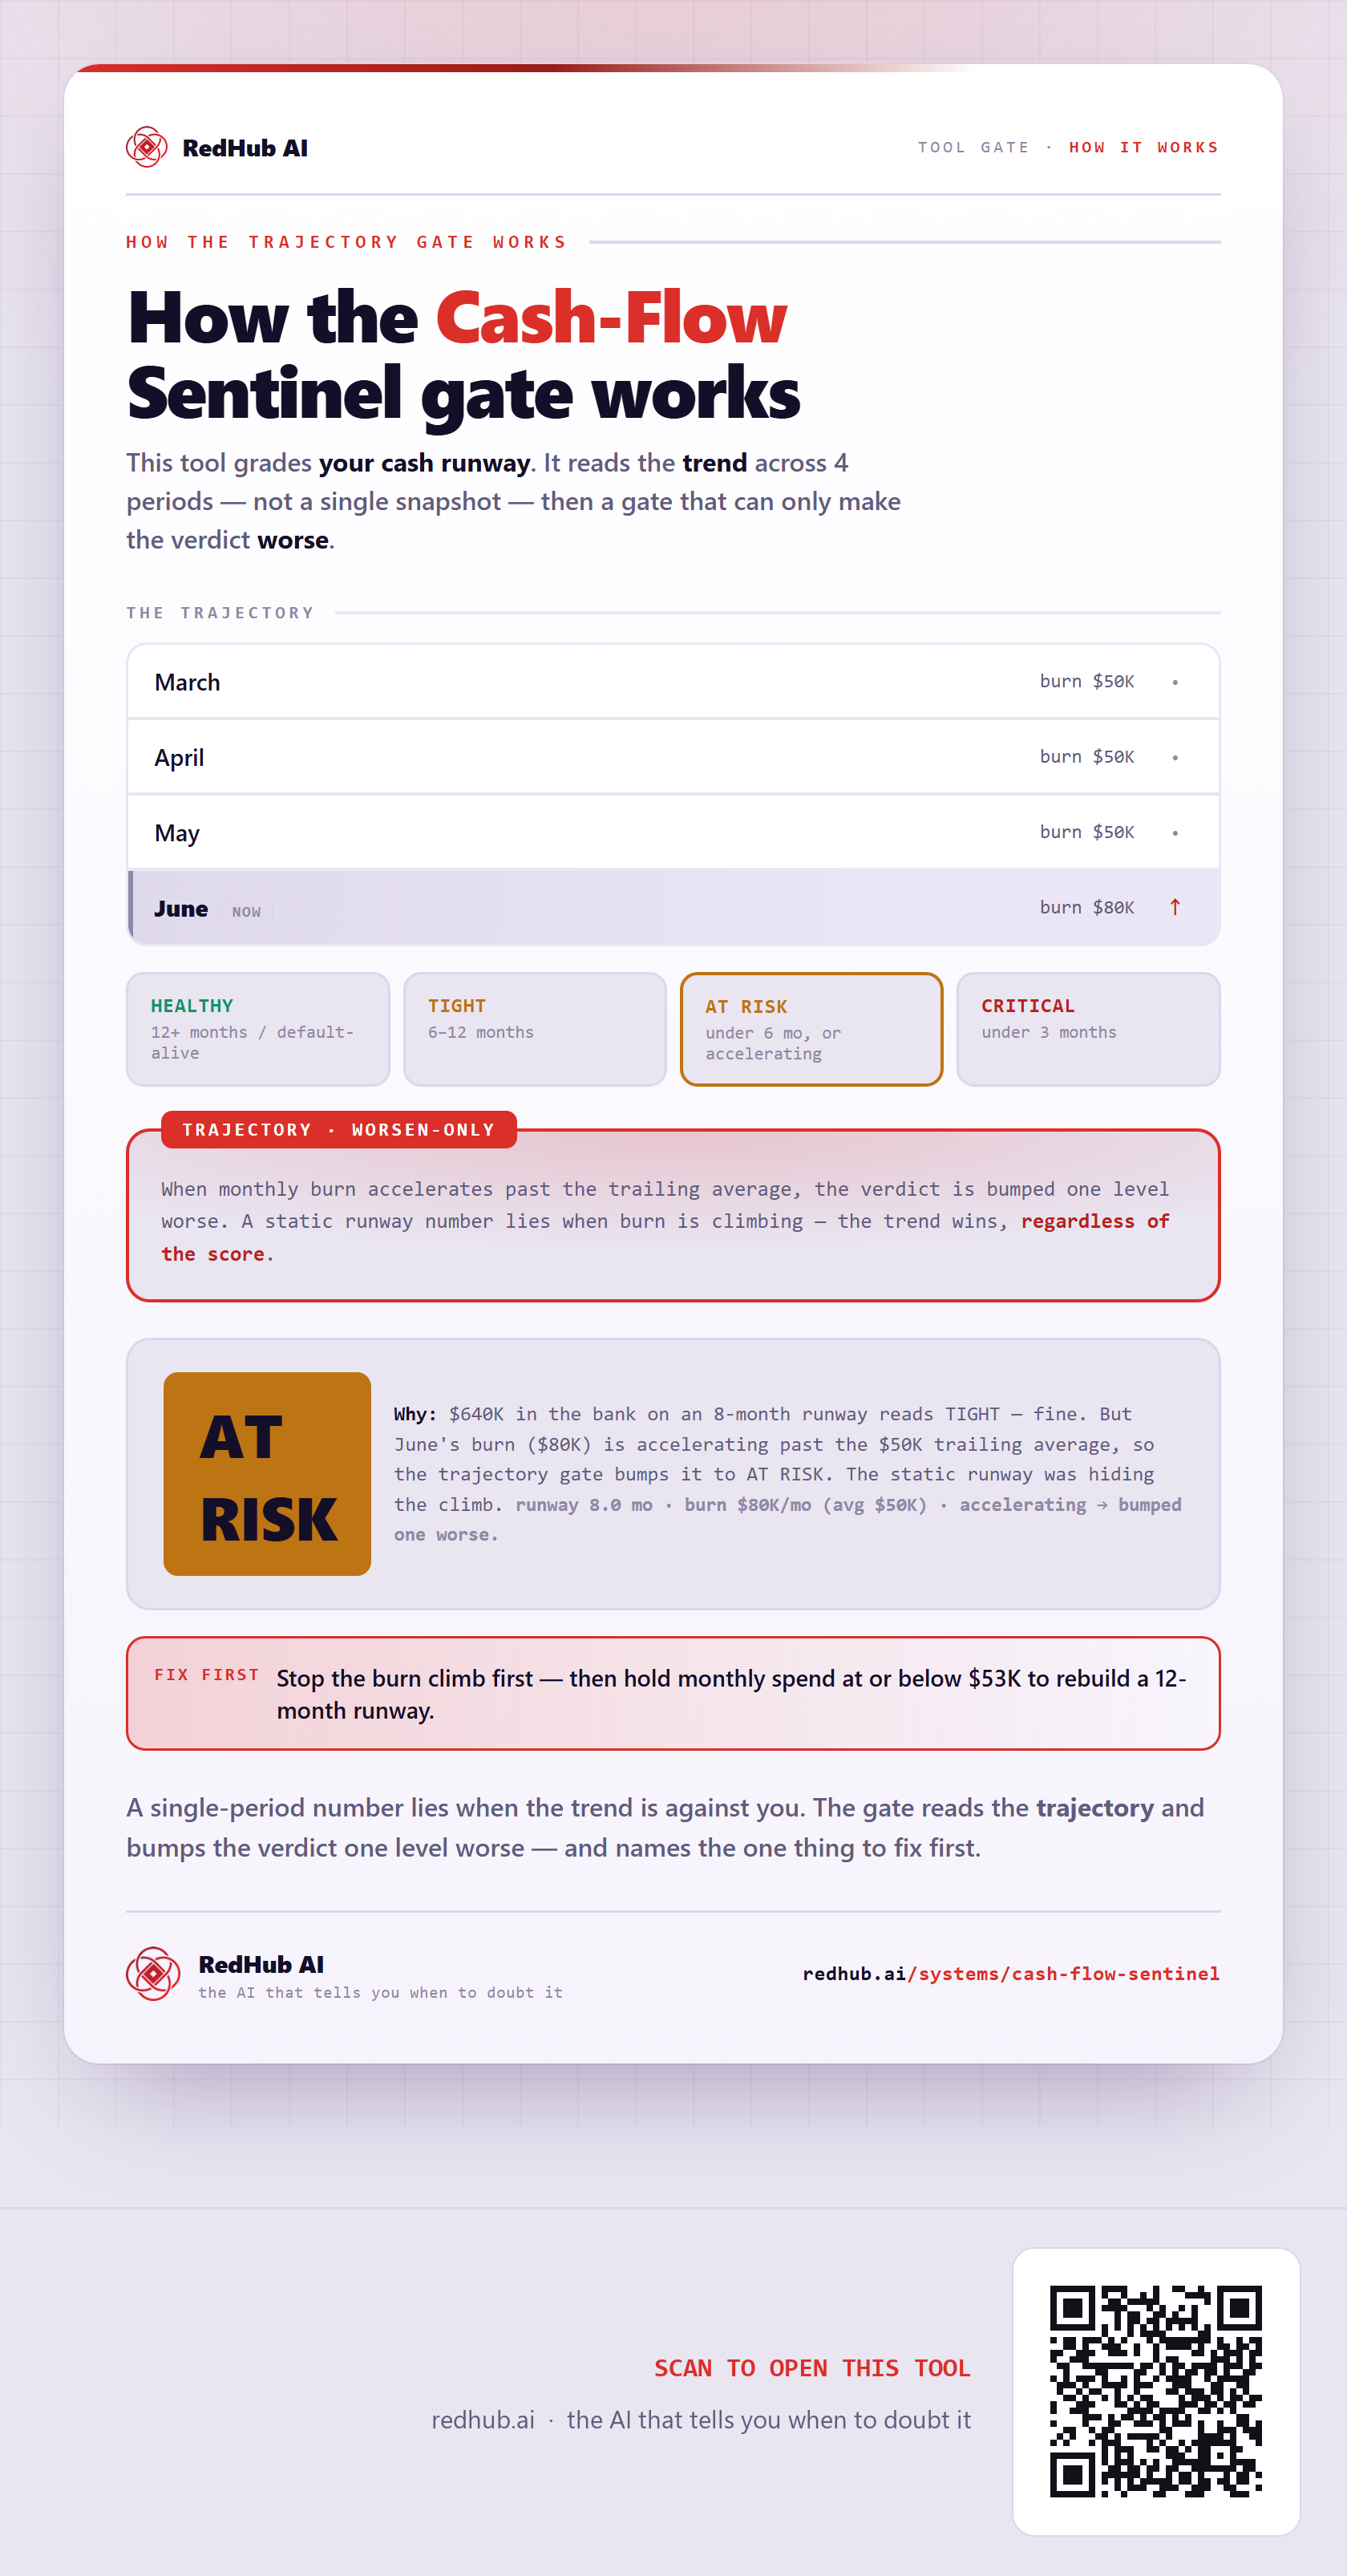
How the Cash-Flow Sentinel reads the trend, not a snapshot: an 8-month runway lands in a band, then a trajectory gate bumps the verdict one level worse when burn is accelerating past the trailing average — which is how a TIGHT runway still reads AT RISK.
How the gate works
This tool grades your cash runway. It reads the trend across 4 periods — not a single snapshot — and then a gate that can only make the verdict worse.
The trajectory
| Period | Reading |
|---|---|
| March | burn $50K |
| April | burn $50K |
| May | burn $50K |
| Junenow | burn $80K↑ |
The verdict bands
When monthly burn accelerates past the trailing average, the verdict is bumped one level worse. A static runway number lies when burn is climbing — the trend wins, regardless of the score.
In the worked sample it reads AT RISK — $640K in the bank on an 8-month runway reads TIGHT — fine. But June's burn ($80K) is accelerating past the $50K trailing average, so the trajectory gate bumps it to AT RISK. The static runway was hiding the climb. Marked fix first on this sample: Stop the burn climb first — then hold monthly spend at or below $53K to rebuild a 12-month runway..
Common questions
Can the headline number look fine on the How the Cash-Flow Sentinel gate works and still fail?
Yes. It reads the trend across 4 periods, not one snapshot; a worsen-only gate, the Trajectory gate, bumps the verdict one level worse when the trajectory is against you. In the worked sample it reads AT RISK because $640K in the bank on an 8-month runway reads TIGHT — fine. But June's burn ($80K) is accelerating past the $50K trailing average, so the trajectory gate bumps it to AT RISK. The static runway was hiding the climb.
What is a worsen-only gate?
A dispositive rule that can only lower a verdict, never raise it. One fatal flaw overrides an otherwise-healthy-looking number, because a single disqualifying gap shouldn't hide behind a static snapshot. Where something is short, the fix-first row names it — here, "Stop the burn climb first — then hold monthly spend at or below $53K to rebuild a 12-month runway.".
Embed this diagram
Free to share and embed with attribution (CC BY 4.0) — keep the link to redhub.ai.
Interactive — renders the live diagram
<iframe src="https://redhub.ai/visuals/tool/cash-flow-sentinel.html" title="How the Cash-Flow Sentinel gate works — RedHub AI" width="760" height="1480" loading="lazy" style="border:0;width:100%;max-width:760px"></iframe>
<p style="font:14px/1.5 system-ui,sans-serif"><a href="https://redhub.ai/visuals/tool/cash-flow-sentinel">How the Cash-Flow Sentinel gate works</a> — by <a href="https://redhub.ai">RedHub AI</a>, the AI that tells you when to doubt it.</p>
Image + link — a static picture for any blog
<a href="https://redhub.ai/visuals/tool/cash-flow-sentinel"><img src="https://redhub.ai/visuals/tool/cash-flow-sentinel-share.png" alt="Diagram of the Cash-Flow Sentinel: a four-month burn trajectory, a trajectory gate that bumps the verdict when burn accelerates, and an 8-month runway reading AT RISK." width="760" loading="lazy" style="max-width:100%;height:auto;border-radius:16px"></a>
<p style="font:14px/1.5 system-ui,sans-serif"><a href="https://redhub.ai">RedHub AI</a> — the AI that tells you when to doubt it.</p>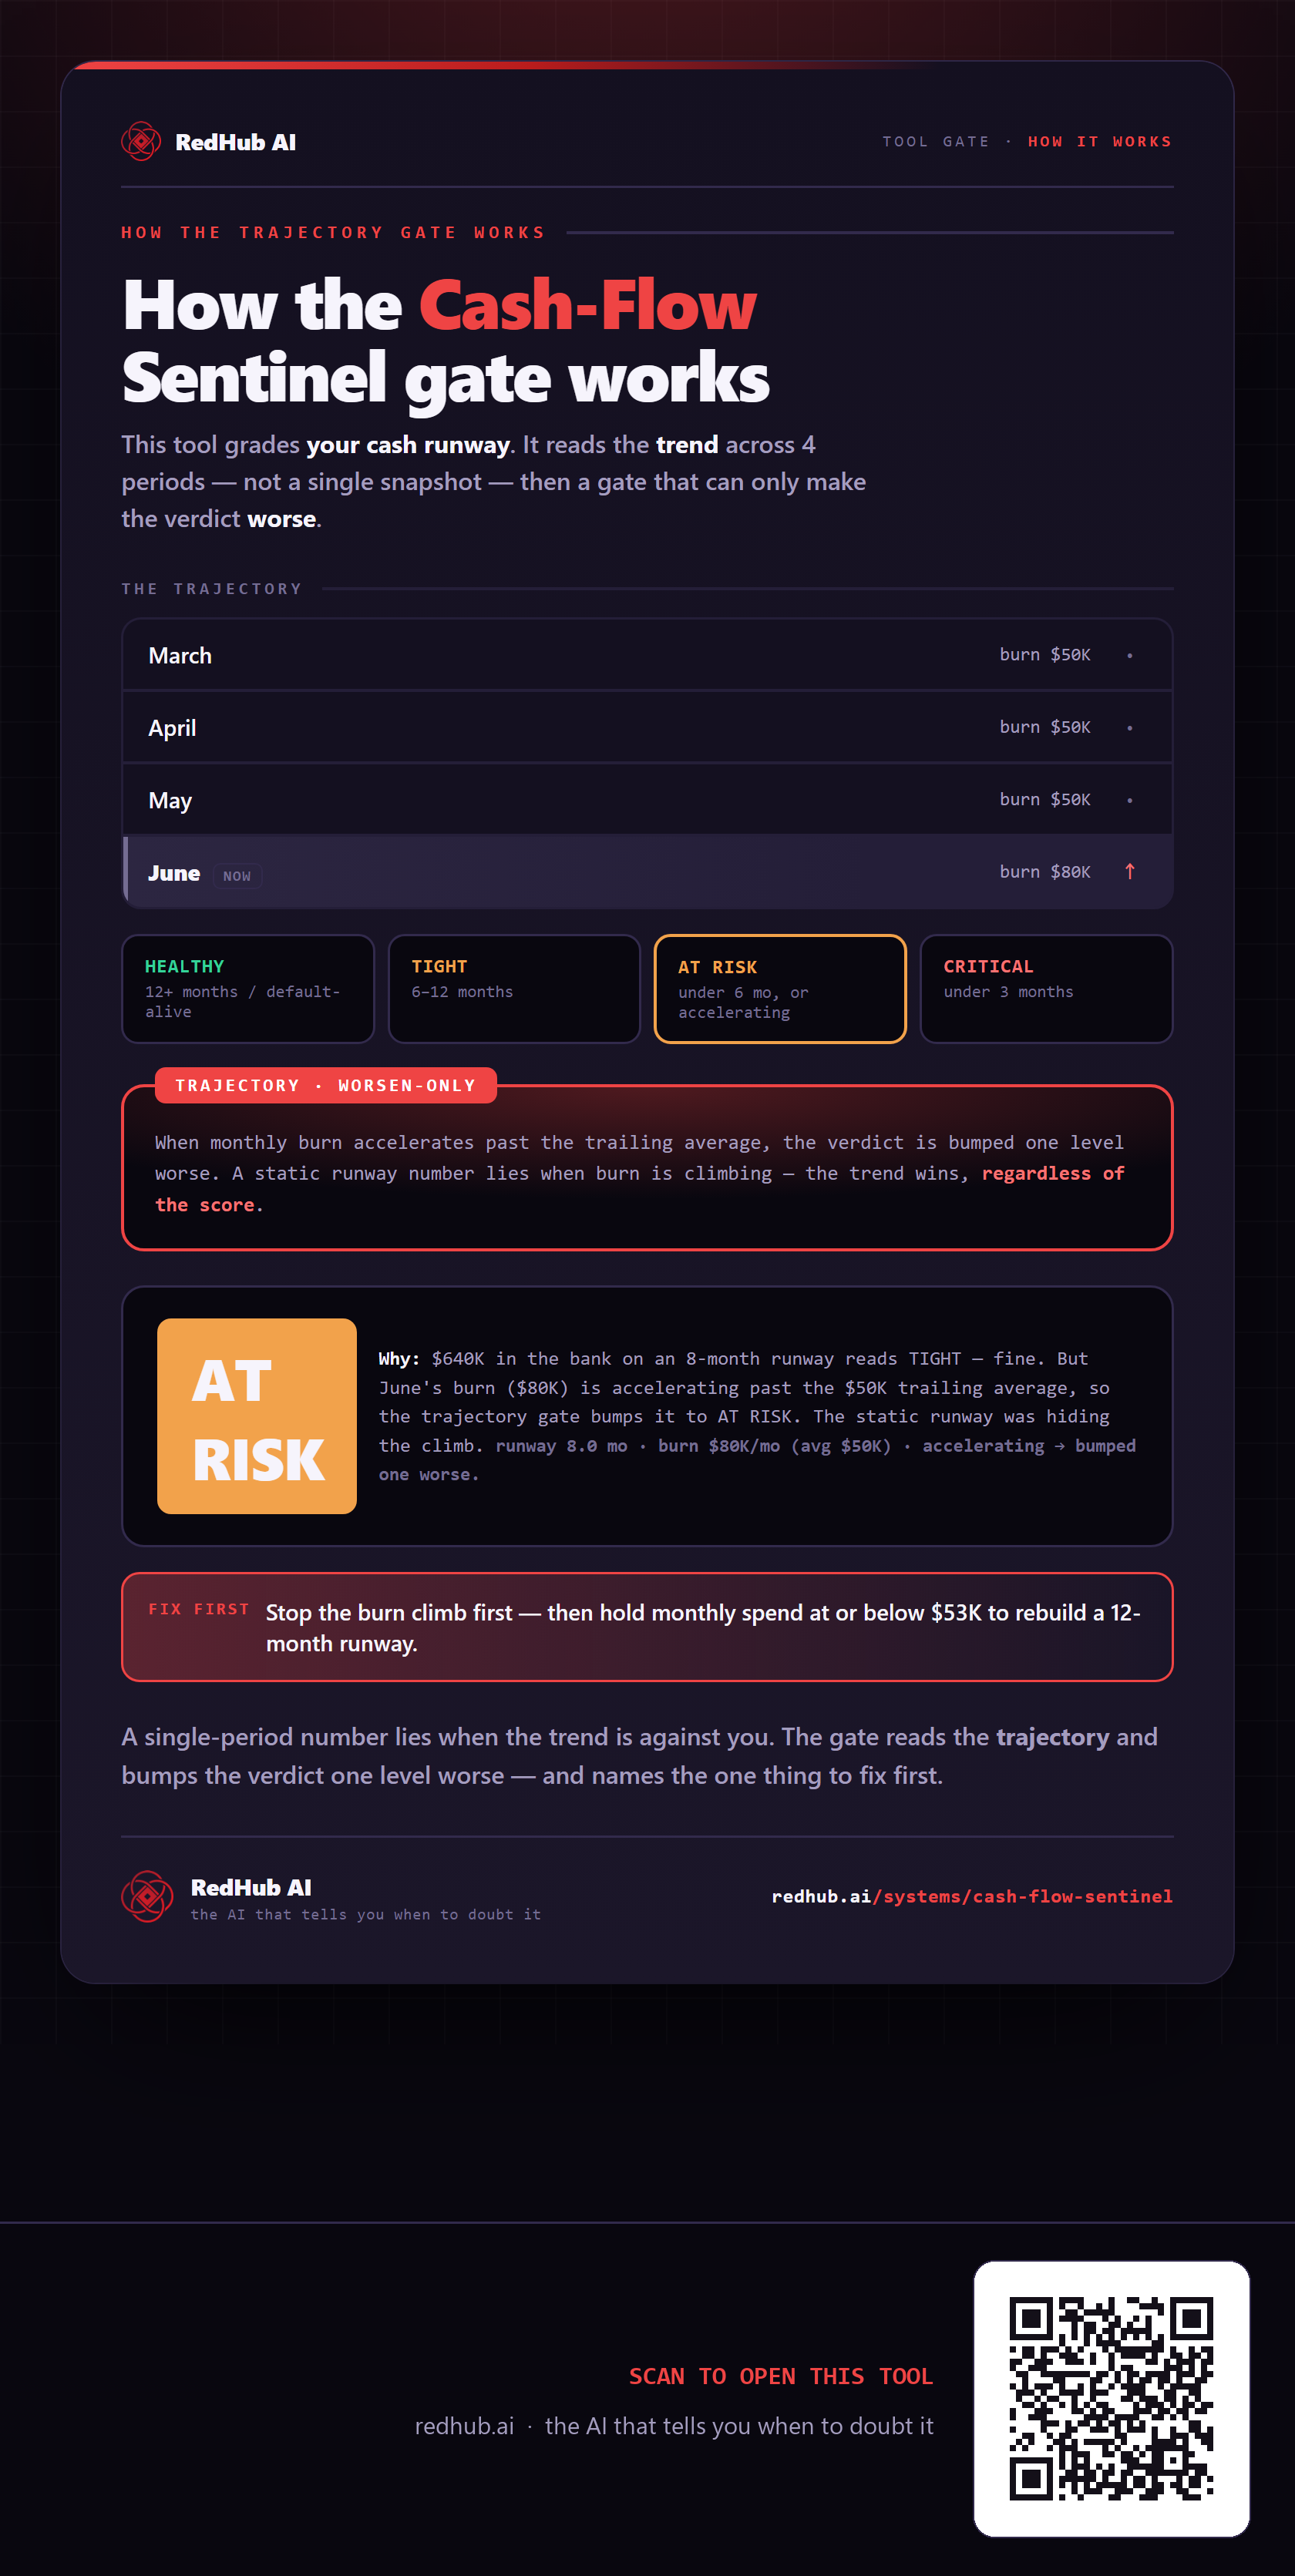
This is how Cash-Flow Sentinel works. More diagrams in the Visual Field Guide.