Tool Gate · How it works
How the Backlog-to-Capacity Lead-Time Reality Check gate works
How the Backlog-to-Capacity Lead-Time Reality Check rolls up 7 work centers: a diverging-queue gate forces LEAD-TIME FICTION when one center's intake outruns its throughput — which is how a shop that looks on-schedule ratio-by-ratio still reads LEAD-TIME FICTION.
How the gate works
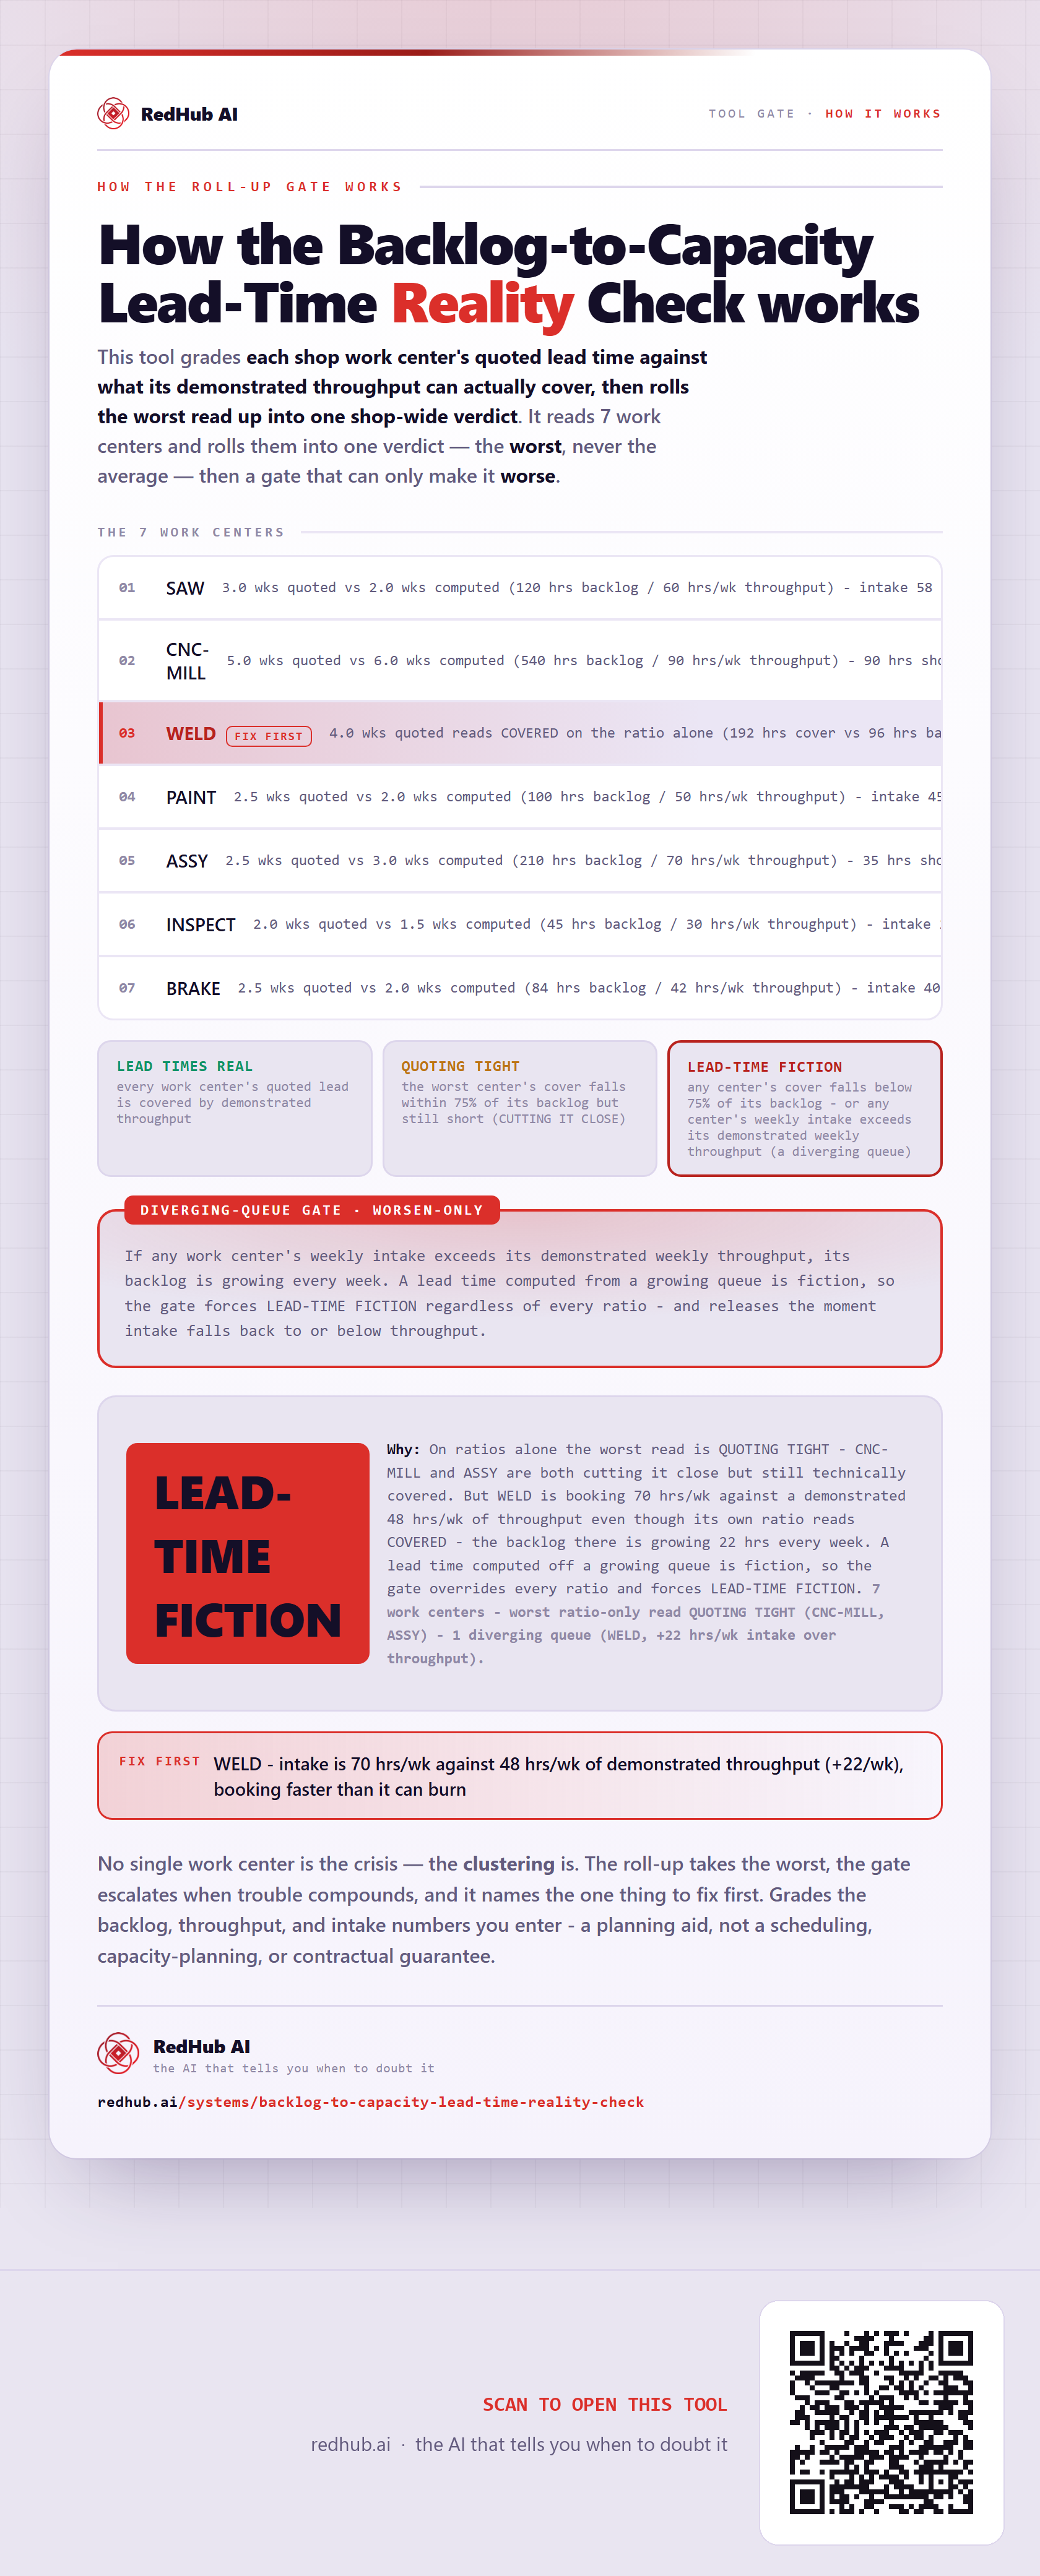
This tool grades each shop work center's quoted lead time against what its demonstrated throughput can actually cover, then rolls the worst read up into one shop-wide verdict. It reads 7 work centers and rolls them into one verdict — the worst, never the average — and then a gate that can only make it worse.
The 7 work centers
| Work center | Verdict |
|---|---|
| SAW | COVERED3.0 wks quoted vs 2.0 wks computed (120 hrs backlog / 60 hrs/wk throughput) - intake 58 hrs/wk, steady |
| CNC-MILL | CUTTING IT CLOSE5.0 wks quoted vs 6.0 wks computed (540 hrs backlog / 90 hrs/wk throughput) - 90 hrs short of covering the backlog, intake 88 hrs/wk steady |
| WELDfix first | DIVERGING QUEUE4.0 wks quoted reads COVERED on the ratio alone (192 hrs cover vs 96 hrs backlog) - but intake is 70 hrs/wk against only 48 hrs/wk of demonstrated throughput, +22 hrs every week |
| PAINT | COVERED2.5 wks quoted vs 2.0 wks computed (100 hrs backlog / 50 hrs/wk throughput) - intake 45 hrs/wk, steady |
| ASSY | CUTTING IT CLOSE2.5 wks quoted vs 3.0 wks computed (210 hrs backlog / 70 hrs/wk throughput) - 35 hrs short of covering the backlog, intake 66 hrs/wk steady |
| INSPECT | COVERED2.0 wks quoted vs 1.5 wks computed (45 hrs backlog / 30 hrs/wk throughput) - intake 28 hrs/wk, steady |
| BRAKE | COVERED2.5 wks quoted vs 2.0 wks computed (84 hrs backlog / 42 hrs/wk throughput) - intake 40 hrs/wk, steady |
The verdict bands
If any work center's weekly intake exceeds its demonstrated weekly throughput, its backlog is growing every week. A lead time computed from a growing queue is fiction, so the gate forces LEAD-TIME FICTION regardless of every ratio - and releases the moment intake falls back to or below throughput.
In the worked sample it reads LEAD-TIME FICTION — On ratios alone the worst read is QUOTING TIGHT - CNC-MILL and ASSY are both cutting it close but still technically covered. But WELD is booking 70 hrs/wk against a demonstrated 48 hrs/wk of throughput even though its own ratio reads COVERED - the backlog there is growing 22 hrs every week. A lead time computed off a growing queue is fiction, so the gate overrides every ratio and forces LEAD-TIME FICTION. Marked fix first on this sample: WELD - intake is 70 hrs/wk against 48 hrs/wk of demonstrated throughput (+22/wk), booking faster than it can burn.
Common questions
Can every work center look survivable on the How the Backlog-to-Capacity Lead-Time Reality Check works and the company still read LEAD-TIME FICTION?
Yes. The roll-up takes the worst of 7 work centers — never the average — then a worsen-only gate, the Diverging-queue gate gate, escalates when trouble clusters. In the worked sample it reads LEAD-TIME FICTION because on ratios alone the worst read is QUOTING TIGHT - CNC-MILL and ASSY are both cutting it close but still technically covered. But WELD is booking 70 hrs/wk against a demonstrated 48 hrs/wk of throughput even though its own ratio reads COVERED - the backlog there is growing 22 hrs every week. A lead time computed off a growing queue is fiction, so the gate overrides every ratio and forces LEAD-TIME FICTION.
What is a worsen-only gate?
A dispositive rule that can only lower a verdict, never raise it. One fatal flaw overrides an otherwise-set of survivable lines, because a single disqualifying gap shouldn't hide behind an average of the healthy ones. Where something is short, the fix-first row names it — here, "WELD - intake is 70 hrs/wk against 48 hrs/wk of demonstrated throughput (+22/wk), booking faster than it can burn".
Grades the backlog, throughput, and intake numbers you enter - a planning aid, not a scheduling, capacity-planning, or contractual guarantee.
Embed this diagram
Free to share and embed with attribution (CC BY 4.0) — keep the link to redhub.ai.
Interactive — renders the live diagram
<iframe src="https://redhub.ai/visuals/tool/backlog-to-capacity-lead-time-reality-check.html" title="How the Backlog-to-Capacity Lead-Time Reality Check gate works — RedHub AI" width="760" height="1979" loading="lazy" style="border:0;width:100%;max-width:760px"></iframe>
<p style="font:14px/1.5 system-ui,sans-serif"><a href="https://redhub.ai/visuals/tool/backlog-to-capacity-lead-time-reality-check">How the Backlog-to-Capacity Lead-Time Reality Check gate works</a> — by <a href="https://redhub.ai">RedHub AI</a>, the AI that tells you when to doubt it.</p>
Image + link — a static picture for any blog
<a href="https://redhub.ai/visuals/tool/backlog-to-capacity-lead-time-reality-check"><img src="https://redhub.ai/visuals/tool/backlog-to-capacity-lead-time-reality-check-share.png" alt="Diagram of the Backlog-to-Capacity Lead-Time Reality Check: seven work centers rolled up to the worst, a diverging-queue gate, and the shop reading LEAD-TIME FICTION." width="760" loading="lazy" style="max-width:100%;height:auto;border-radius:16px"></a>
<p style="font:14px/1.5 system-ui,sans-serif"><a href="https://redhub.ai">RedHub AI</a> — the AI that tells you when to doubt it.</p>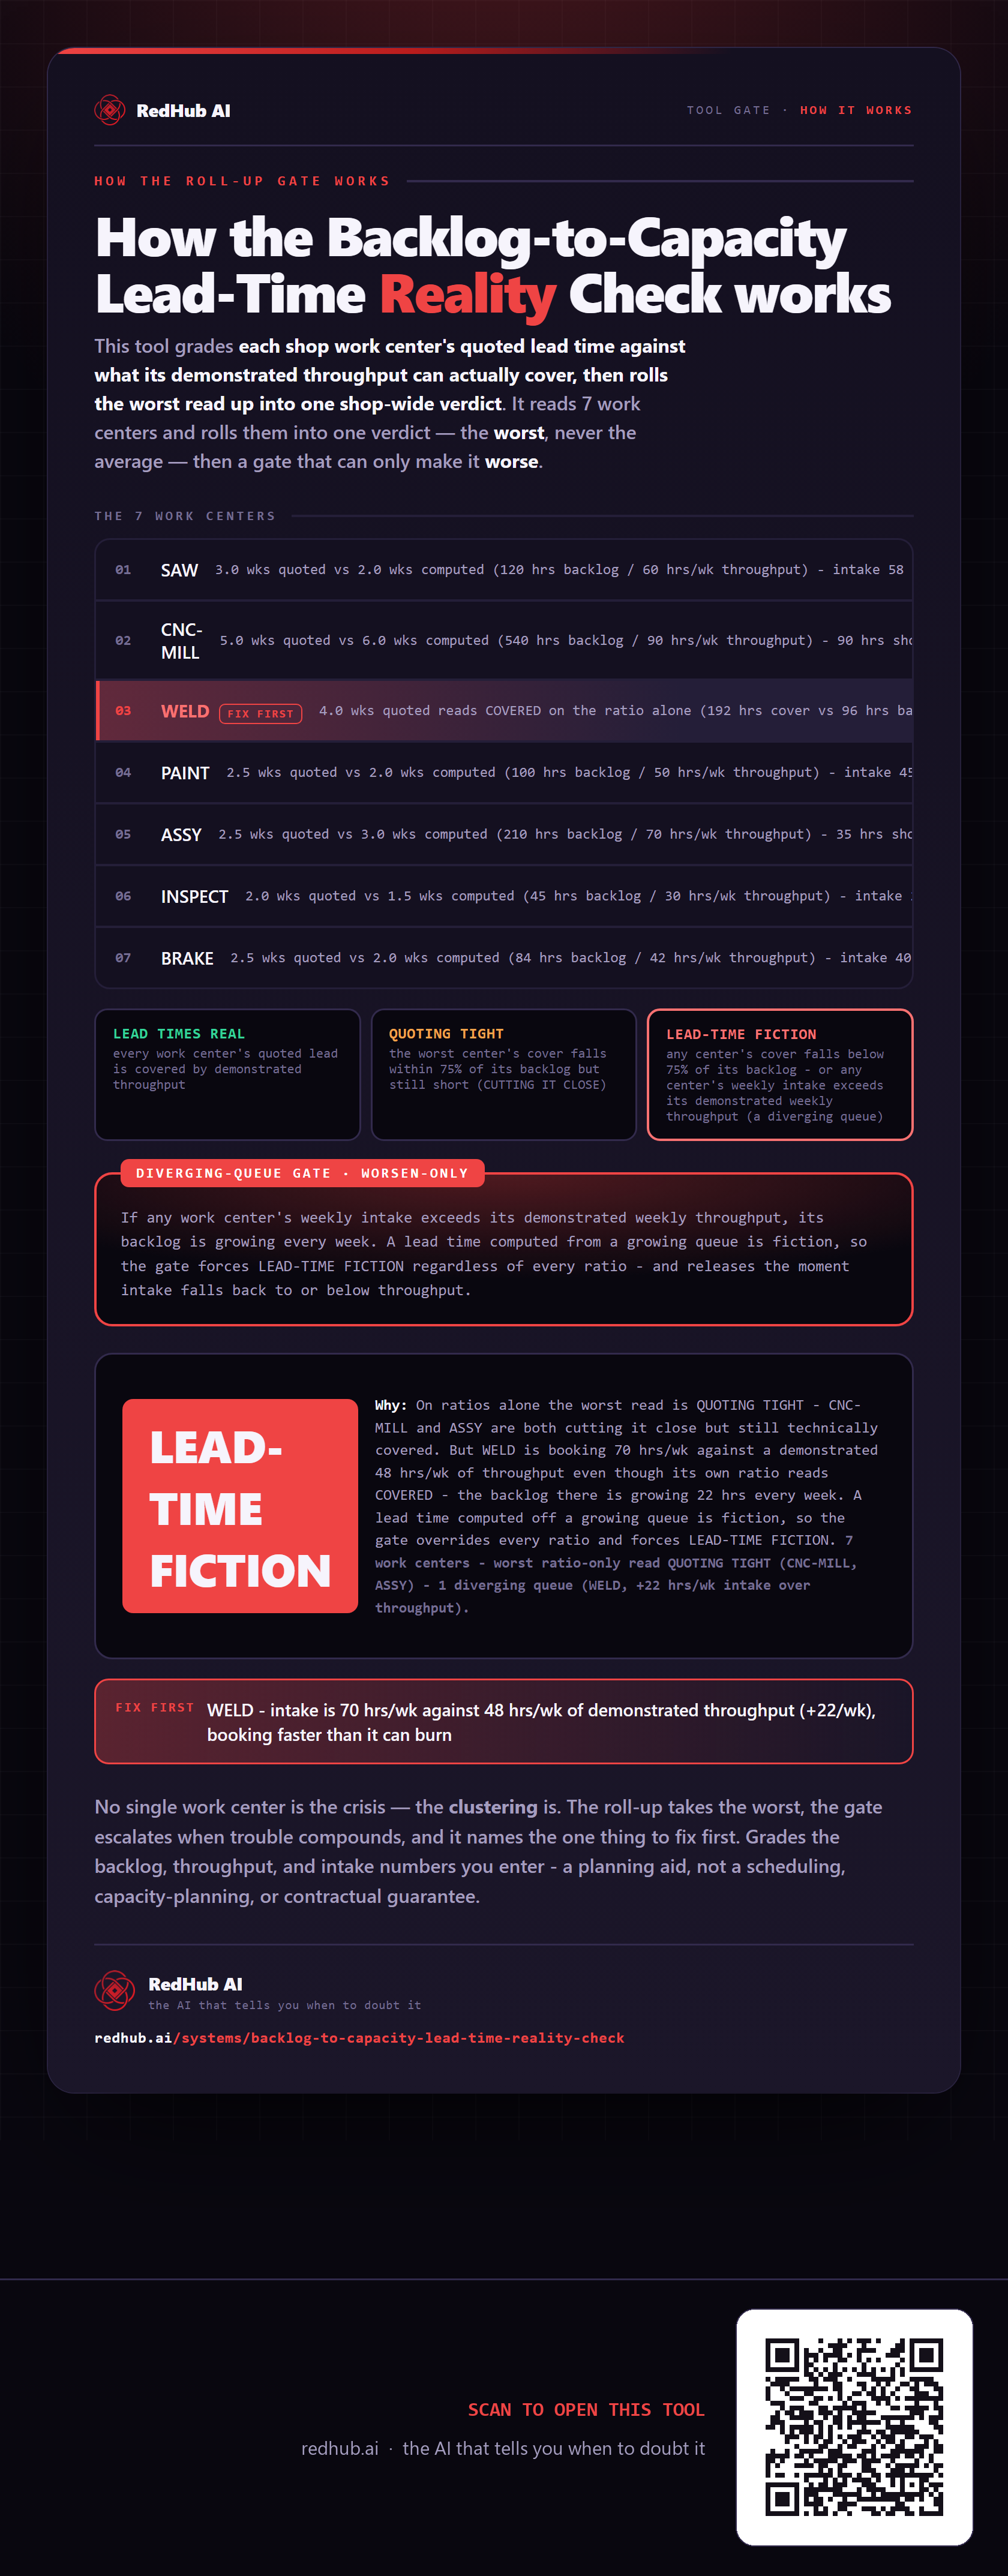
This is how Backlog-to-Capacity Lead-Time Reality Check works. More diagrams in the Visual Field Guide.