Core Web Vitals Revenue-Impact Gate
Grade every page against Google's 2026 thresholds, find the one metric dragging it down, and put a dollar figure on the slow ones — from your own conversion numbers, not an invented multiplier.
instant download · .xlsx · yours to keep
The problem
A respectable-looking dashboard can still be failing.
Google grades a page on its worst Core Web Vital, at the 75th percentile of real mobile visitors. Flawless INP and CLS but a slow LCP? The page still fails — and roughly half the mobile web fails with it. The cost isn't just rankings: a page that loads slowly or jumps as it loads is a silent conversion leak. This kit grades each page, names the failing metric, and turns the leak into a number you can take to a stakeholder.
The three metrics
Three metrics, one rule: all three must be good.
LCP — loading
≤ 2.5sLargest Contentful Paint: how fast the main content appears.
INP — responsiveness
≤ 200msInteraction to Next Paint: how fast the page answers a tap. The metric most sites fail.
CLS — visual stability
≤ 0.1Cumulative Layout Shift: how much the page jumps as it loads.
The standard
Your numbers — no invented multiplier.
Worst metric wins
The verdict is the weakest of the three, mirroring how Search Console grades a URL group by its worst metric. Two good metrics never rescue one failing one.
Your sensitivity, your call
The revenue figure uses a per-100ms sensitivity you set in a labeled, editable cell. RedHub asserts no industry lift and guarantees no recovery.
Field data, not lab
You enter the real-user numbers Google ranks on, from Search Console or PageSpeed's field section — not a Lighthouse score that flatters a fast test device.
See it work
Enter one page's field values and your numbers.
Live gate · one page (mobile field data)
good ≤ 2500ms
good ≤ 200ms
good ≤ 0.1
your own number — not an industry figure RedHub asserts
Page verdict
NEEDS WORK
fails good: LCP (loading)
fix first: LCP (loading)
Preload the hero image, inline critical CSS, preload fonts, improve TTFB — never lazy-load the LCP image.
Thresholds are Google's published 2026 values (75th-pct, mobile). You paste field values you measured — no live data, no industry multiplier, no guaranteed outcome.
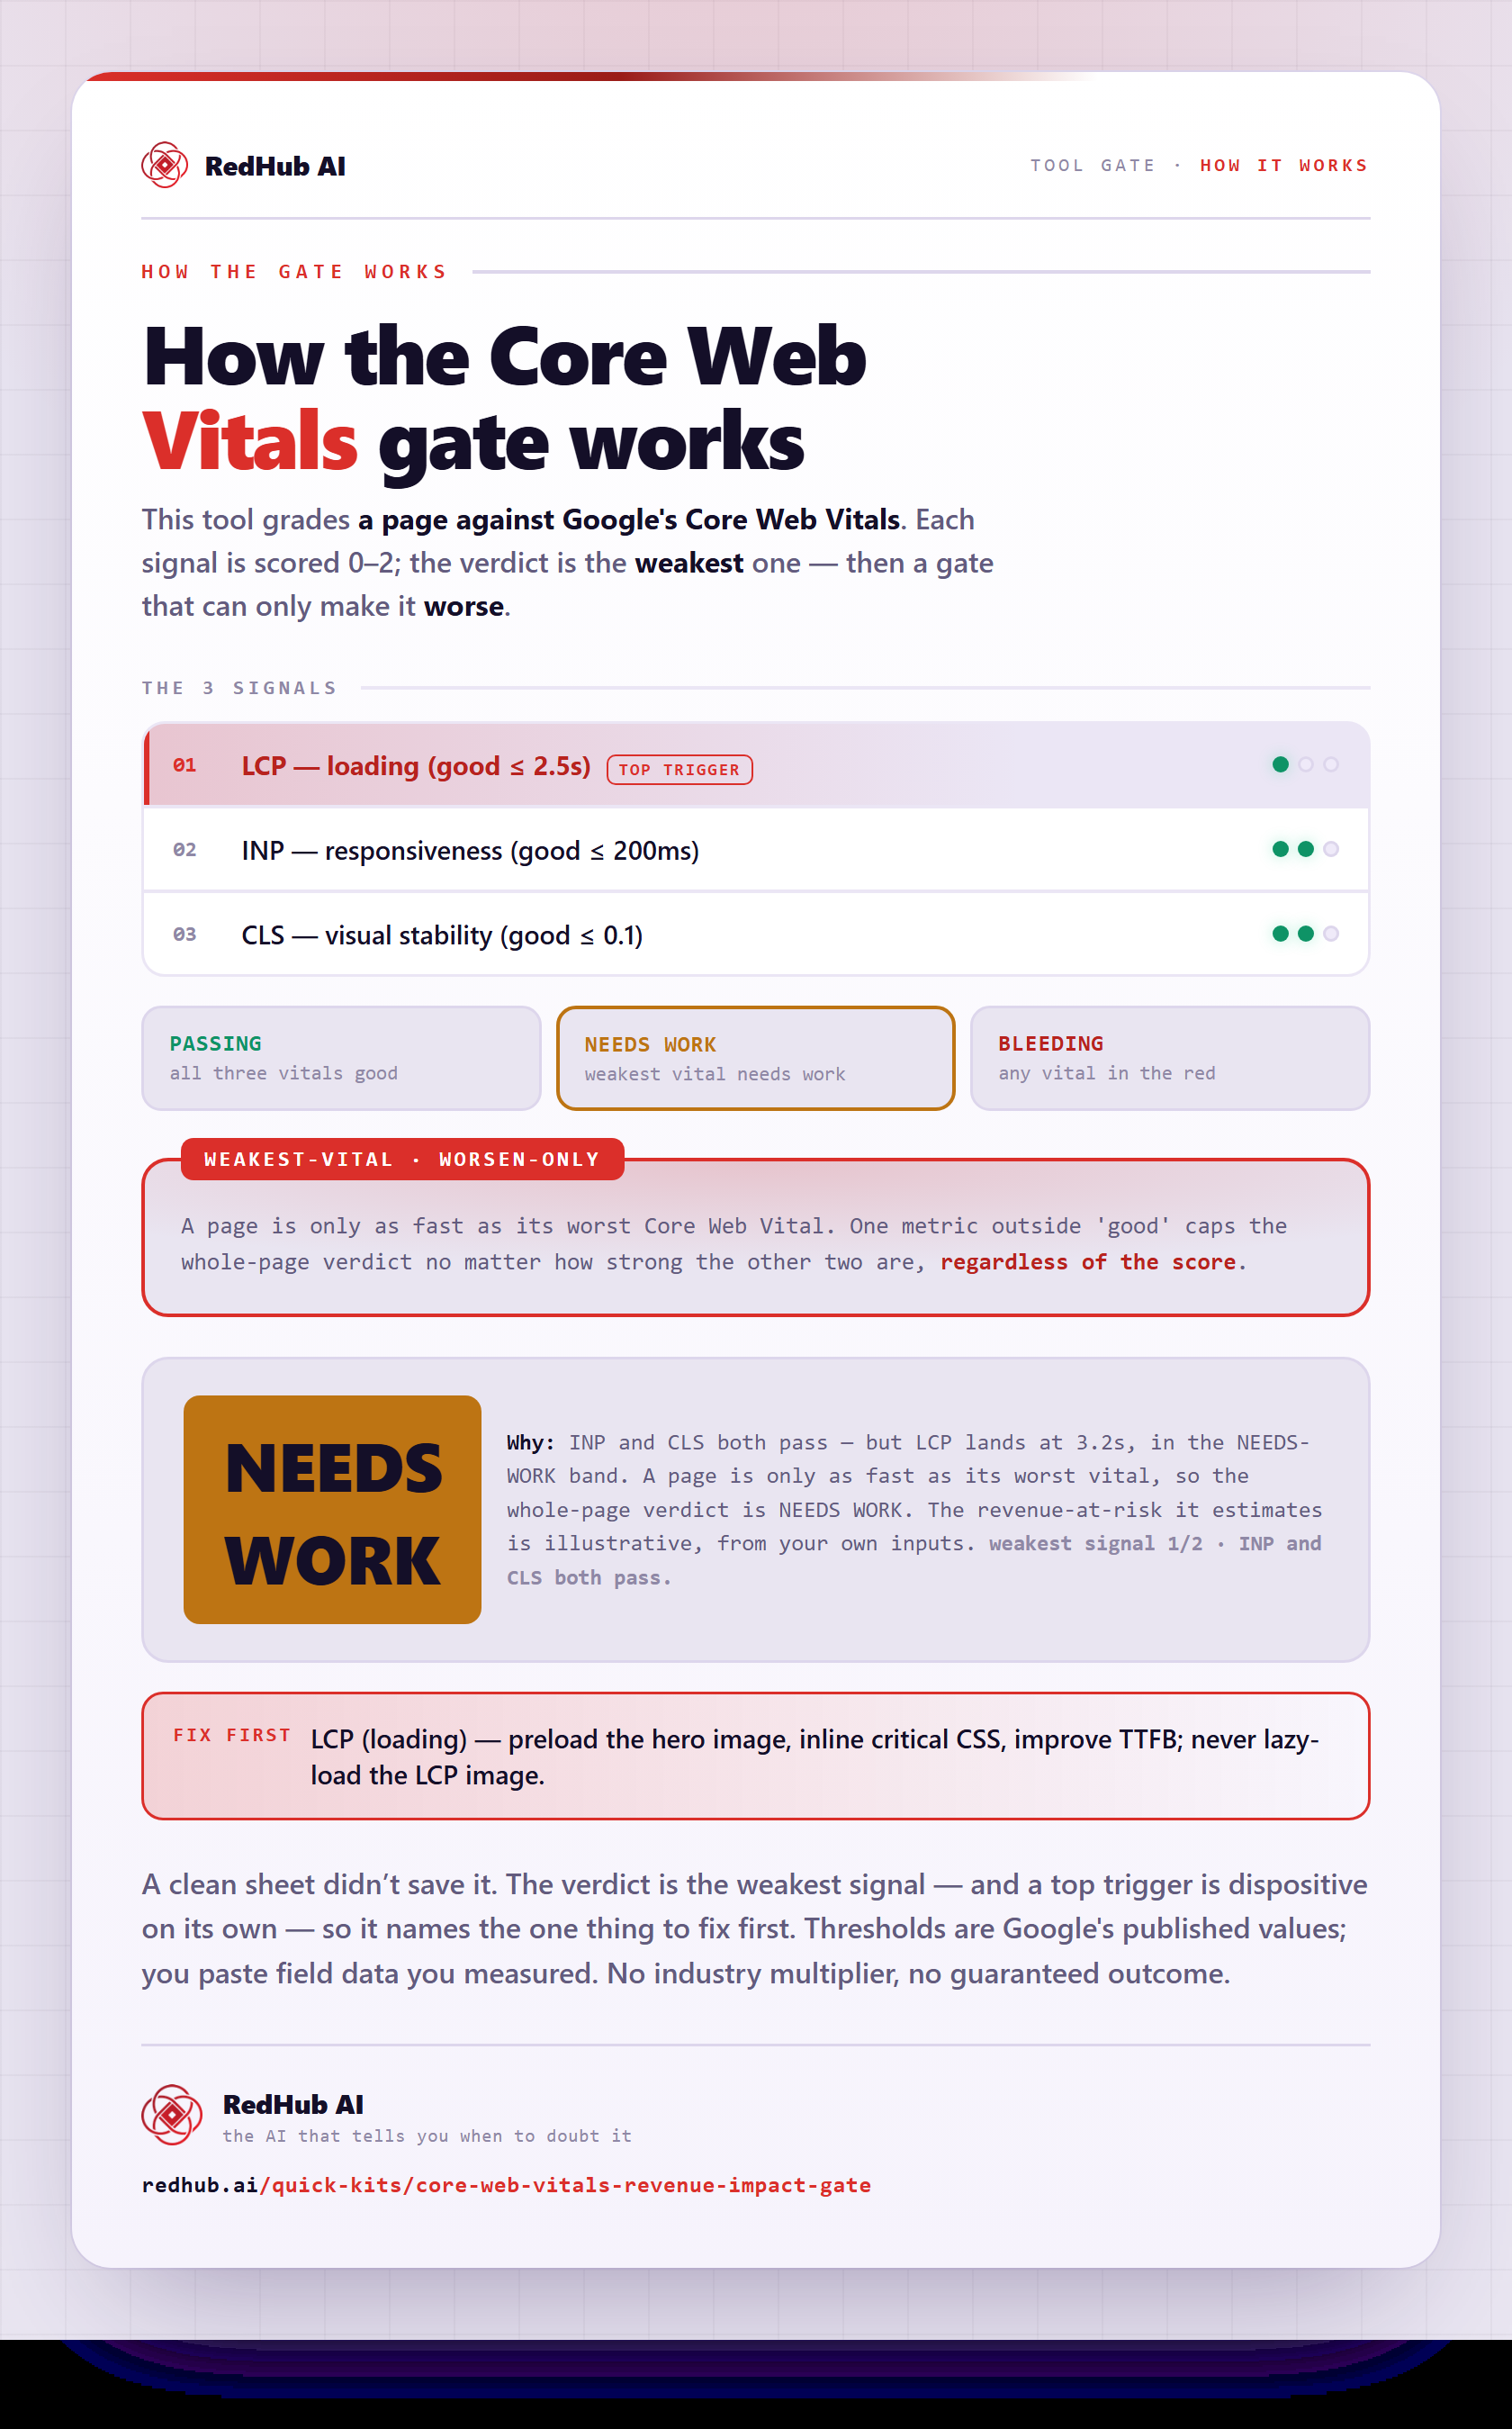
How the gate works, in one image
LCP, INP, and CLS scored against Google's thresholds, with the whole-page verdict set by the weakest vital — the same math the demo runs, as a diagram you can share or embed anywhere.
View & embed the full diagramThis is the live engine. The .xlsx grades every page at once and rolls them up to a site verdict. Total annual revenue at risk across the site, from your own assumptions.
Get the kit — $49What you'll see
A verdict per page, a number for the site.
PASSING
All three metrics good. Hold the line — the bar rises as the web gets faster.
NEEDS WORK
One metric in the warning band. Fix it before it tips into poor.
BLEEDING
A metric is poor; the page fails Core Web Vitals and money is leaking now.
Who it's for
Anyone making the case to fix page speed.
- Ecommerce & SaaS owners — to see which templates leak the most revenue.
- SEO & growth teams — to prioritize by business impact, not by whichever metric is satisfying to fix.
- Agencies & freelancers — to turn a speed audit into a dollar figure a client will fund.
- Developers — to point the team at the one failing metric per template, with the fix noted.
Scope: grades field values you paste against Google's published thresholds and estimates revenue at risk from your own inputs. It reads no live data, ranks no people, and guarantees no ranking change or revenue recovery. Not legal or financial advice.
Pairs well with
Fix the speed, then the rest of the funnel.
A fast page is the foundation; protect what it earns. The Website Lead-Leak & Form-Failure Gate makes sure your forms actually deliver the leads, the Cart-Recovery Sequence Effectiveness Gate recovers the carts that still slip away, and the AI Search Brand-Presence Diagnostic checks you even show up when buyers ask an AI.
Common Questions
Straight answers before you buy.
Get the kit
Find the slow pages. Price the leak.
- One .xlsx — Start Here, Dashboard, CWV Calculator.
- The 2026 thresholds built in; your conversion numbers drive the dollars.
- Deterministic and offline — your inputs, no live data, no multiplier.
Sold by RedHub AI LLC · Secured by Stripe · redhub.ai