AI Agent Quiet-Failure & Drift Monitor Kit
Every step in your agent looks 90% reliable. Eight of them in a row succeed together 43% of the time. That compounding is invisible in any single metric — and it's where agents quietly fail. This .xlsx makes it visible.
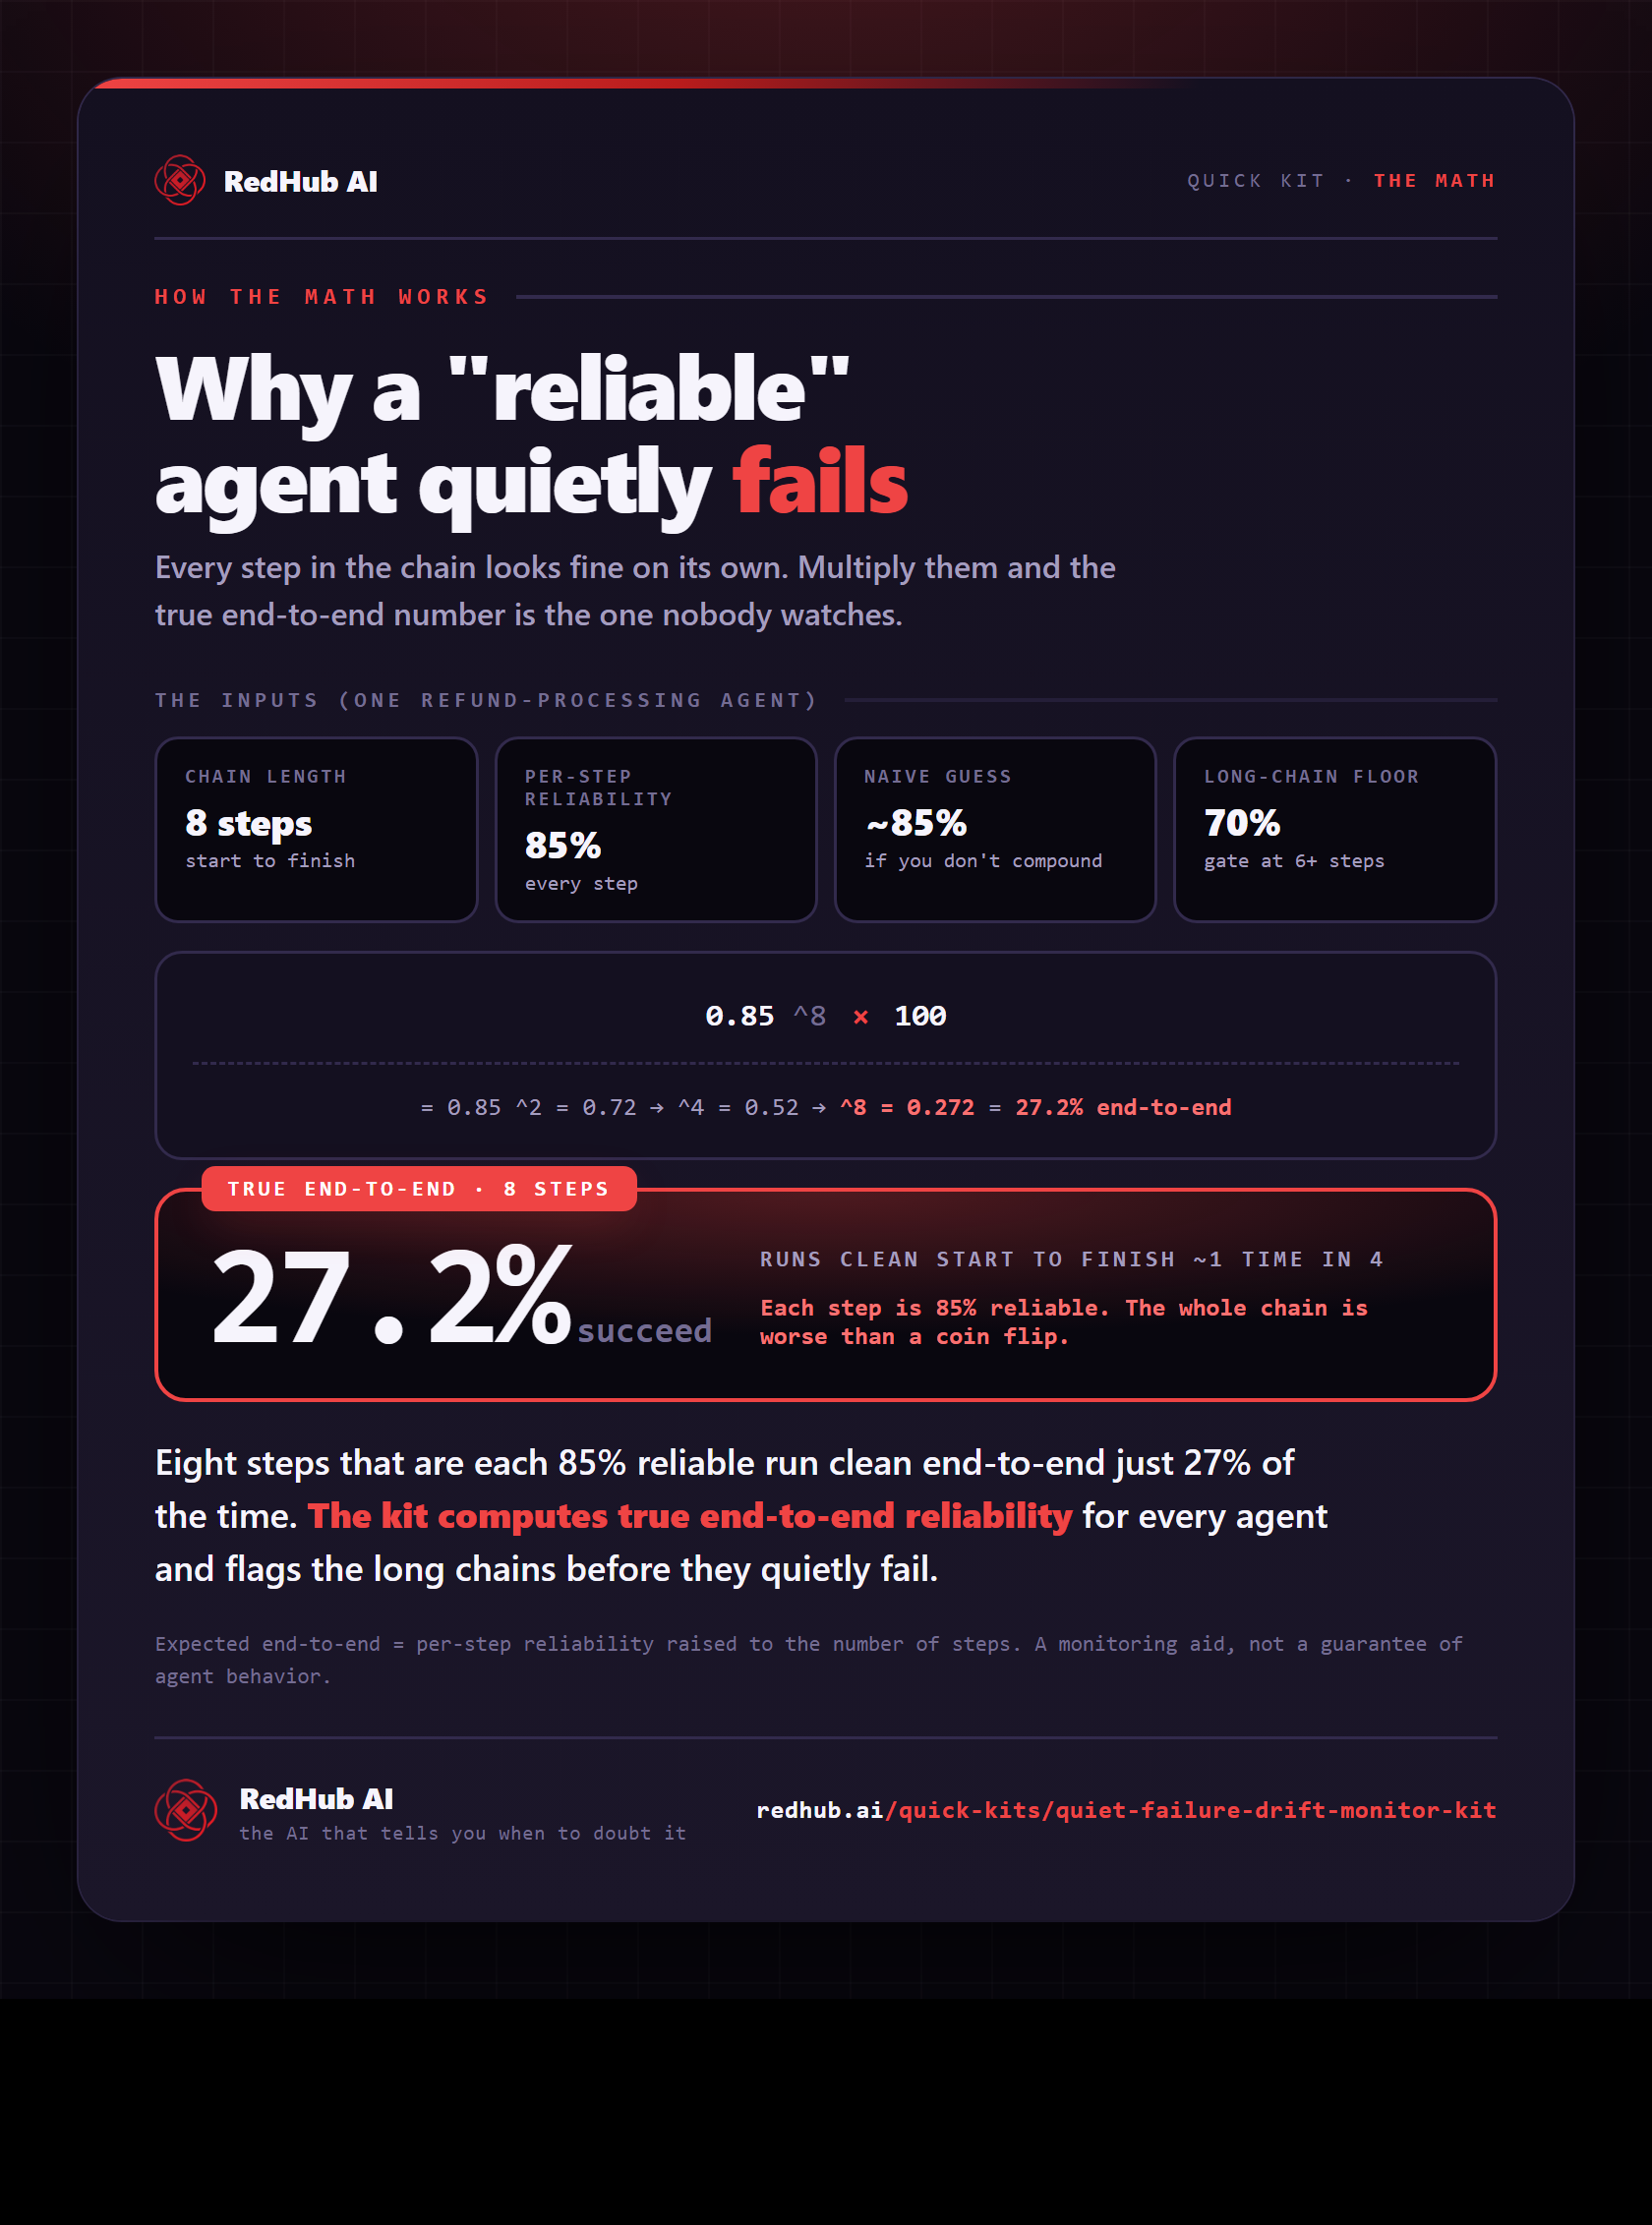
An 8-step chain at 85% per step has a true end-to-end success rate of 27.2%. The kit computes that for every workflow, flags the ones that have drifted below even that, and tells you which to shorten and which to put a checkpoint on.
one-time · instant download · yours to keep
The problem
Per-step reliability hides the failure that matters.
An 8-step agent at 85% per step succeeds end-to-end barely a quarter of the time. Nobody set out to ship a 27% workflow.
The drop doesn't trigger an error. Each step 'worked' — the chain just didn't. It surfaces as a confused customer, not a stack trace.
A large share of agentic projects are forecast to be scrapped — much of it from reliability nobody measured end-to-end until it was live.
What's inside
One workbook. Three tabs. Every agent scored.
What each input means, why compounding matters, and how to read the three verdicts.
A row per agent: steps, per-step reliability, optional observed rate → expected e2e, drift, verdict, and the fix.
Fleet drift rate and posture (HOLDING / WATCH / DRIFTING), pulled live from the monitor tab.
The standard
Three rules keep the verdict honest.
End-to-end success = per-step reliability to the power of the step count. No averaging that hides the chain.
If you have an observed rate, the kit compares it to expected and flags the gap. A regressed step can't hide behind a healthy-looking average.
Past a certain length, compounding alone sinks the rate. The long-chain gate says SHORTEN — a structural fix, not a knob.
How it works
Change a chain. Watch the truth compound.
Use the −/+ controls to change a chain's length or per-step reliability and watch the true end-to-end rate compound. Worked example as of 2026-06-25.
| Agent | Steps | Step rel. | Expected e2e | Drift | Verdict |
|---|---|---|---|---|---|
| Refund processor | 8 | 85% | 27.2% | — | SHORTEN chain too long |
| Invoice extractor | 3 | 97% | 91.3% | -1.3 | STABLE |
| Lead enricher | 5 | 92% | 65.9% | — | CHECKPOINT |
| Onboarding flow | 7 | 88% | 40.9% | — | SHORTEN chain too long |
| Email triage | 2 | 98% | 96.0% | 0.0 | STABLE |
| Doc classifier | 4 | 90% | 65.6% | -13.6 | CHECKPOINT |
| Order router | 9 | 90% | 38.7% | — | SHORTEN chain too long |
| Ticket summarizer | 2 | 99% | 98.0% | — | STABLE |
Same math as the workbook: expected end-to-end = step reliability raised to the number of steps. Drift is observed minus expected — a big negative means a step quietly regressed. The long-chain gate forces SHORTEN when compounding alone drops a 6+ step chain below 70%. A monitoring aid, not a guarantee of agent behavior.
This is the live engine. Monitor your whole agent fleet in one .xlsx Catch the quiet drift before it hits a customer STABLE / SHORTEN / CHECKPOINT on every workflow
Get the kit — $49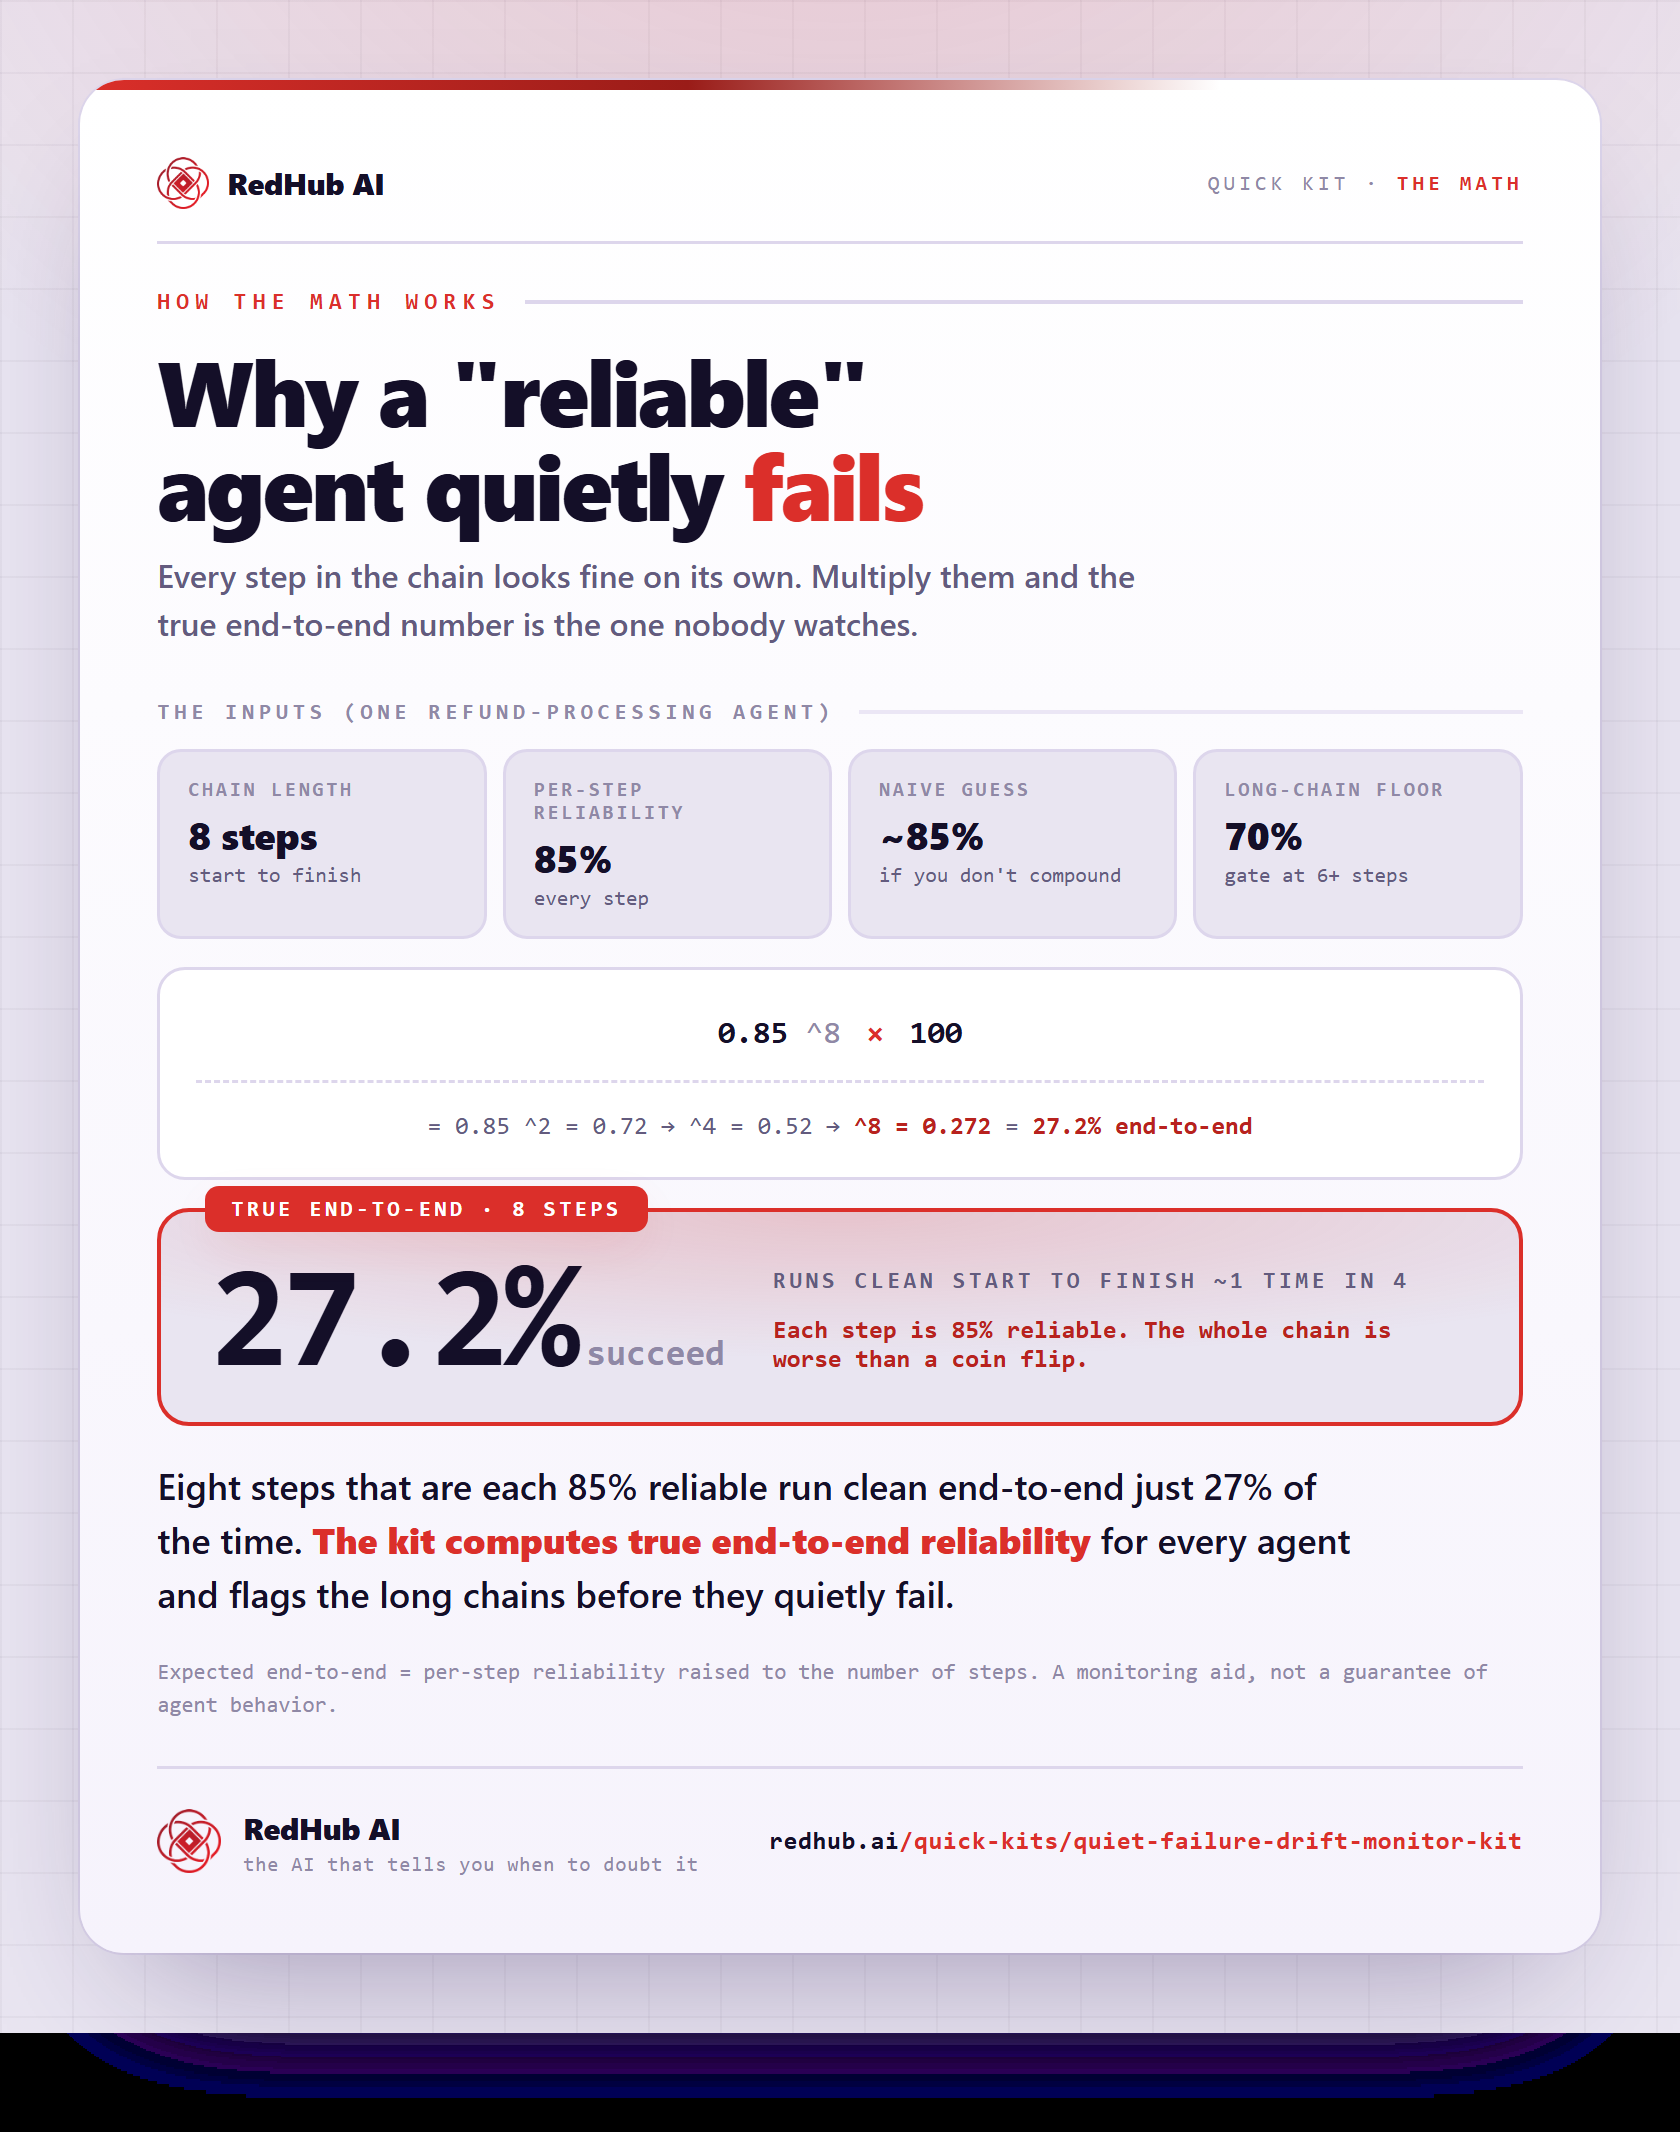
The math behind it, in one image
See the compounding math: 0.85^8 = 27.2% - an 8-step agent with 85%-reliable steps runs clean end-to-end just 1 run in 4.
See the full calculationWhat you'll see
The two agents that make the kit earn its keep.
The refund processor runs 8 steps at 85% each. Every step looks fine on its own — but the chain succeeds end-to-end just 27.2% of the time. No per-step tuning saves it; the gate says shorten the workflow or break it with a checkpoint.
The doc classifier should hit ~66% end-to-end. It's measuring 52% — a 13.6-point negative drift. The chain math didn't change, so a step regressed. That's the quiet failure, caught before it became a pattern.
Who it's for
For the person on the hook when the agent fails.
- You run multi-step agents or chained automations in production.
- You've been burned by a workflow that "worked in testing."
- You want a fast read on which agents to shorten or checkpoint.
- You want a live observability integration — you enter numbers from your logs.
- You need a single-prompt tool, not a multi-step chain, monitored.
- You expect a guarantee of agent behavior. This is a decision aid.
Common Questions
Common questions.
It's a workflow that fails end-to-end without any single step throwing an error. Each step "worked," but the chain didn't — so it never shows up as a stack trace, only as a confused customer or a wrong result. The AI Agent Quiet-Failure & Drift Monitor Kit makes it visible by computing the true compounded success rate of the whole chain, not the per-step rate that looks fine.
Compounding: end-to-end success = per-step reliability raised to the power of the step count. An 8-step agent at 85% per step is 0.85^8 = 27.2% — it succeeds all the way through barely a quarter of the time, even though every step looks healthy on its own. The kit runs that math for every workflow so the chain's real rate stops hiding behind the per-step average.
Drift is your observed end-to-end rate minus what the chain math predicts. If a 4-step agent should hit ~66% but you're measuring 52%, that's −13.6 points of drift — and since the chain length didn't change, a step quietly regressed. A large negative drift is the early signal that something broke without throwing an error. If you don't have an observed rate, the kit still scores the expected rate; drift just stays blank.
It's the structural override that says some chains can't be tuned. Once a workflow is 6+ steps and its expected end-to-end rate has compounded below 70%, the kit forces a SHORTEN verdict regardless of observed drift — because no amount of per-step tuning recovers it; the fix is to shorten the chain or break it with a checkpoint. A shorter chain below the stable floor lands CHECKPOINT instead, so the two paths stay distinct.
Per agent: STABLE means the expected rate clears the floor and there's no meaningful drift. CHECKPOINT means the expected rate is below the stable floor, or a regressed step shows up as bad drift — add a verification step. SHORTEN means the long-chain gate fired: the chain is structurally too long to be reliable. The fleet rolls up to a drift rate and a posture — HOLDING, WATCH, or DRIFTING — so you see the whole roster at a glance.
No live integration — you enter each agent's step count, per-step reliability, and (optionally) observed rate from your own logs, and the .xlsx does the rest. One workbook with three tabs (Start Here, Drift Monitor, Dashboard) that opens in Excel, Google Sheets, or Numbers; deterministic and offline. It's a monitoring and decision aid, not a guarantee of agent behavior.
Pairs well with
Build the reliability stack.
Get the kit
Stop shipping 27% workflows.
- The true end-to-end rate for every agent you run.
- Drift detection that catches a regressed step early.
- A clear SHORTEN-or-CHECKPOINT call on each one.
Sold by RedHub AI LLC · Secured by Stripe · redhub.ai