Cost of Vacancy Calculator
Cost-per-hire is visible; the cost of the seat sitting empty is hidden — and usually far bigger. This puts a daily dollar figure on every unfilled role, so slow hiring stops looking free.
TL;DR
Most cost-of-vacancy calculators overstate by ignoring the salary you're not paying while the role is open. This one subtracts it (and adds temp/overtime), so the net figure holds up in front of a CFO.
instant download · .xlsx · 30-day guarantee
The problem
Slow hiring looks free. It isn't — it's just invisible.
Everyone tracks cost-per-hire. Almost no one prices the days the seat sits empty — even though that cost usually dwarfs the recruiting spend, especially for revenue-generating roles.
Put an honest daily number on it — net of the salary you're not paying — and a stalled requisition stops being a line item nobody owns and starts being a decision.
the cost of every extra day to fill — the case for moving faster
lost revenue minus the salary saved while vacant, plus temp/overtime
impact factor by role criticality — you set it, defensibly
burnout and morale are real but deliberately left uncounted
The revenue-per-employee method is a standard estimate; the figure is only as honest as the impact factor and inputs you enter.
What's inside
One sheet. The open seat, in dollars.
One .xlsx — open it in Excel, Google Sheets, or Numbers and cost out your open roles today.
Cost of Vacancy Calculator
Enter revenue per employee, impact factor, time to fill, open roles, working days, salary, and temp/overtime; the sheet returns daily revenue impact, cost per day of delay, gross cost, salary saved, and the net cost of vacancy — example data filled in, ready to overwrite.
Dashboard
The headline figures in one screen — cost per day of delay and the net cost of vacancy — the line that turns 'we should fill this' into a defensible number.
Honest net math
Gross lost revenue minus the salary and benefits you're not paying while the seat is open, plus temp/overtime to cover — the figure that holds up in front of a CFO, not a scare headline.
Start Here
A one-page primer on the revenue-per-employee formula, how to pick an impact factor by role criticality, and what the kit deliberately leaves out (burnout, morale) so you keep the inputs honest.
How it works
Cost out your open roles
Enter the role's economics and see the cost per day of delay and the net cost of vacancy. This is the model from the kit.
Daily revenue impact / role
$1,154
Cost per day of delay
$1,615
Gross cost of vacancy
$103,846
Net cost of vacancy
2 roles · 45 days
$78,692
Gross lost revenue ($103,846) minus salary & benefits you're not paying ($31,154) plus temp/overtime ($6,000). Hard revenue only — burnout and morale aren't counted.
This is the live engine. Fill roles before they bleed — the recruiting playbooks, screening systems, and AI workflows that shorten time-to-fill.
Get the kit — $39Estimates hard revenue impact from your inputs; impact factor and working days are yours to set. Keep them honest.
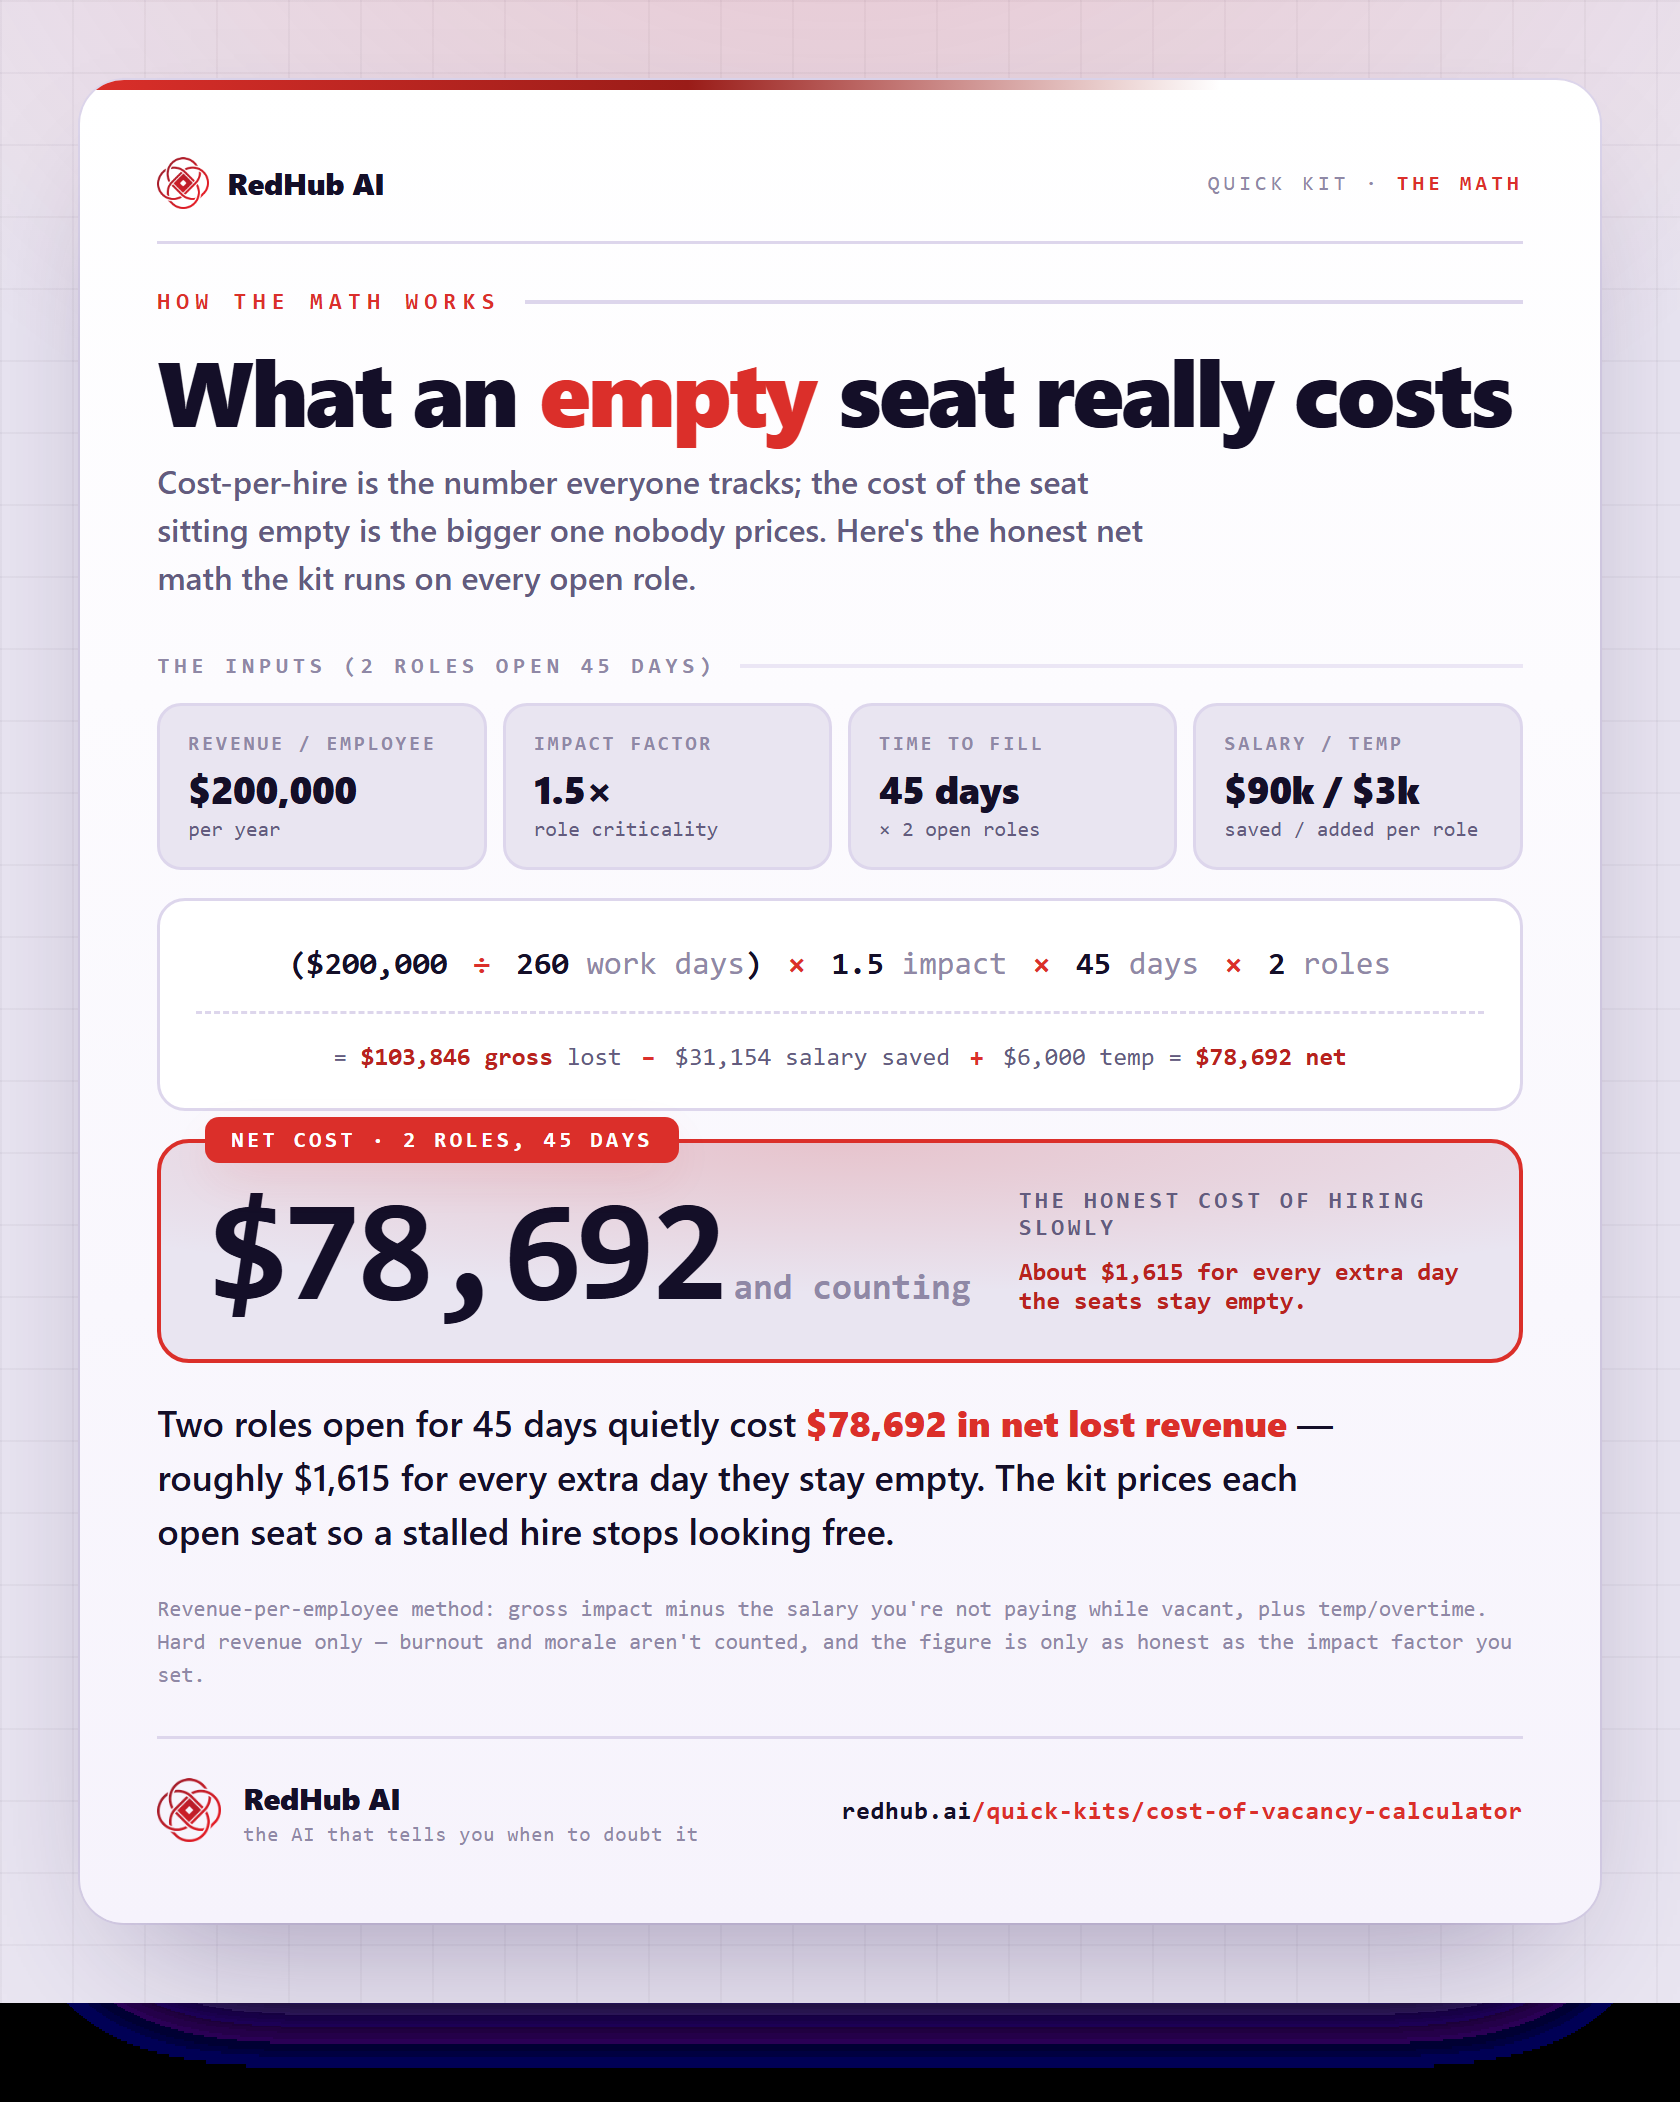
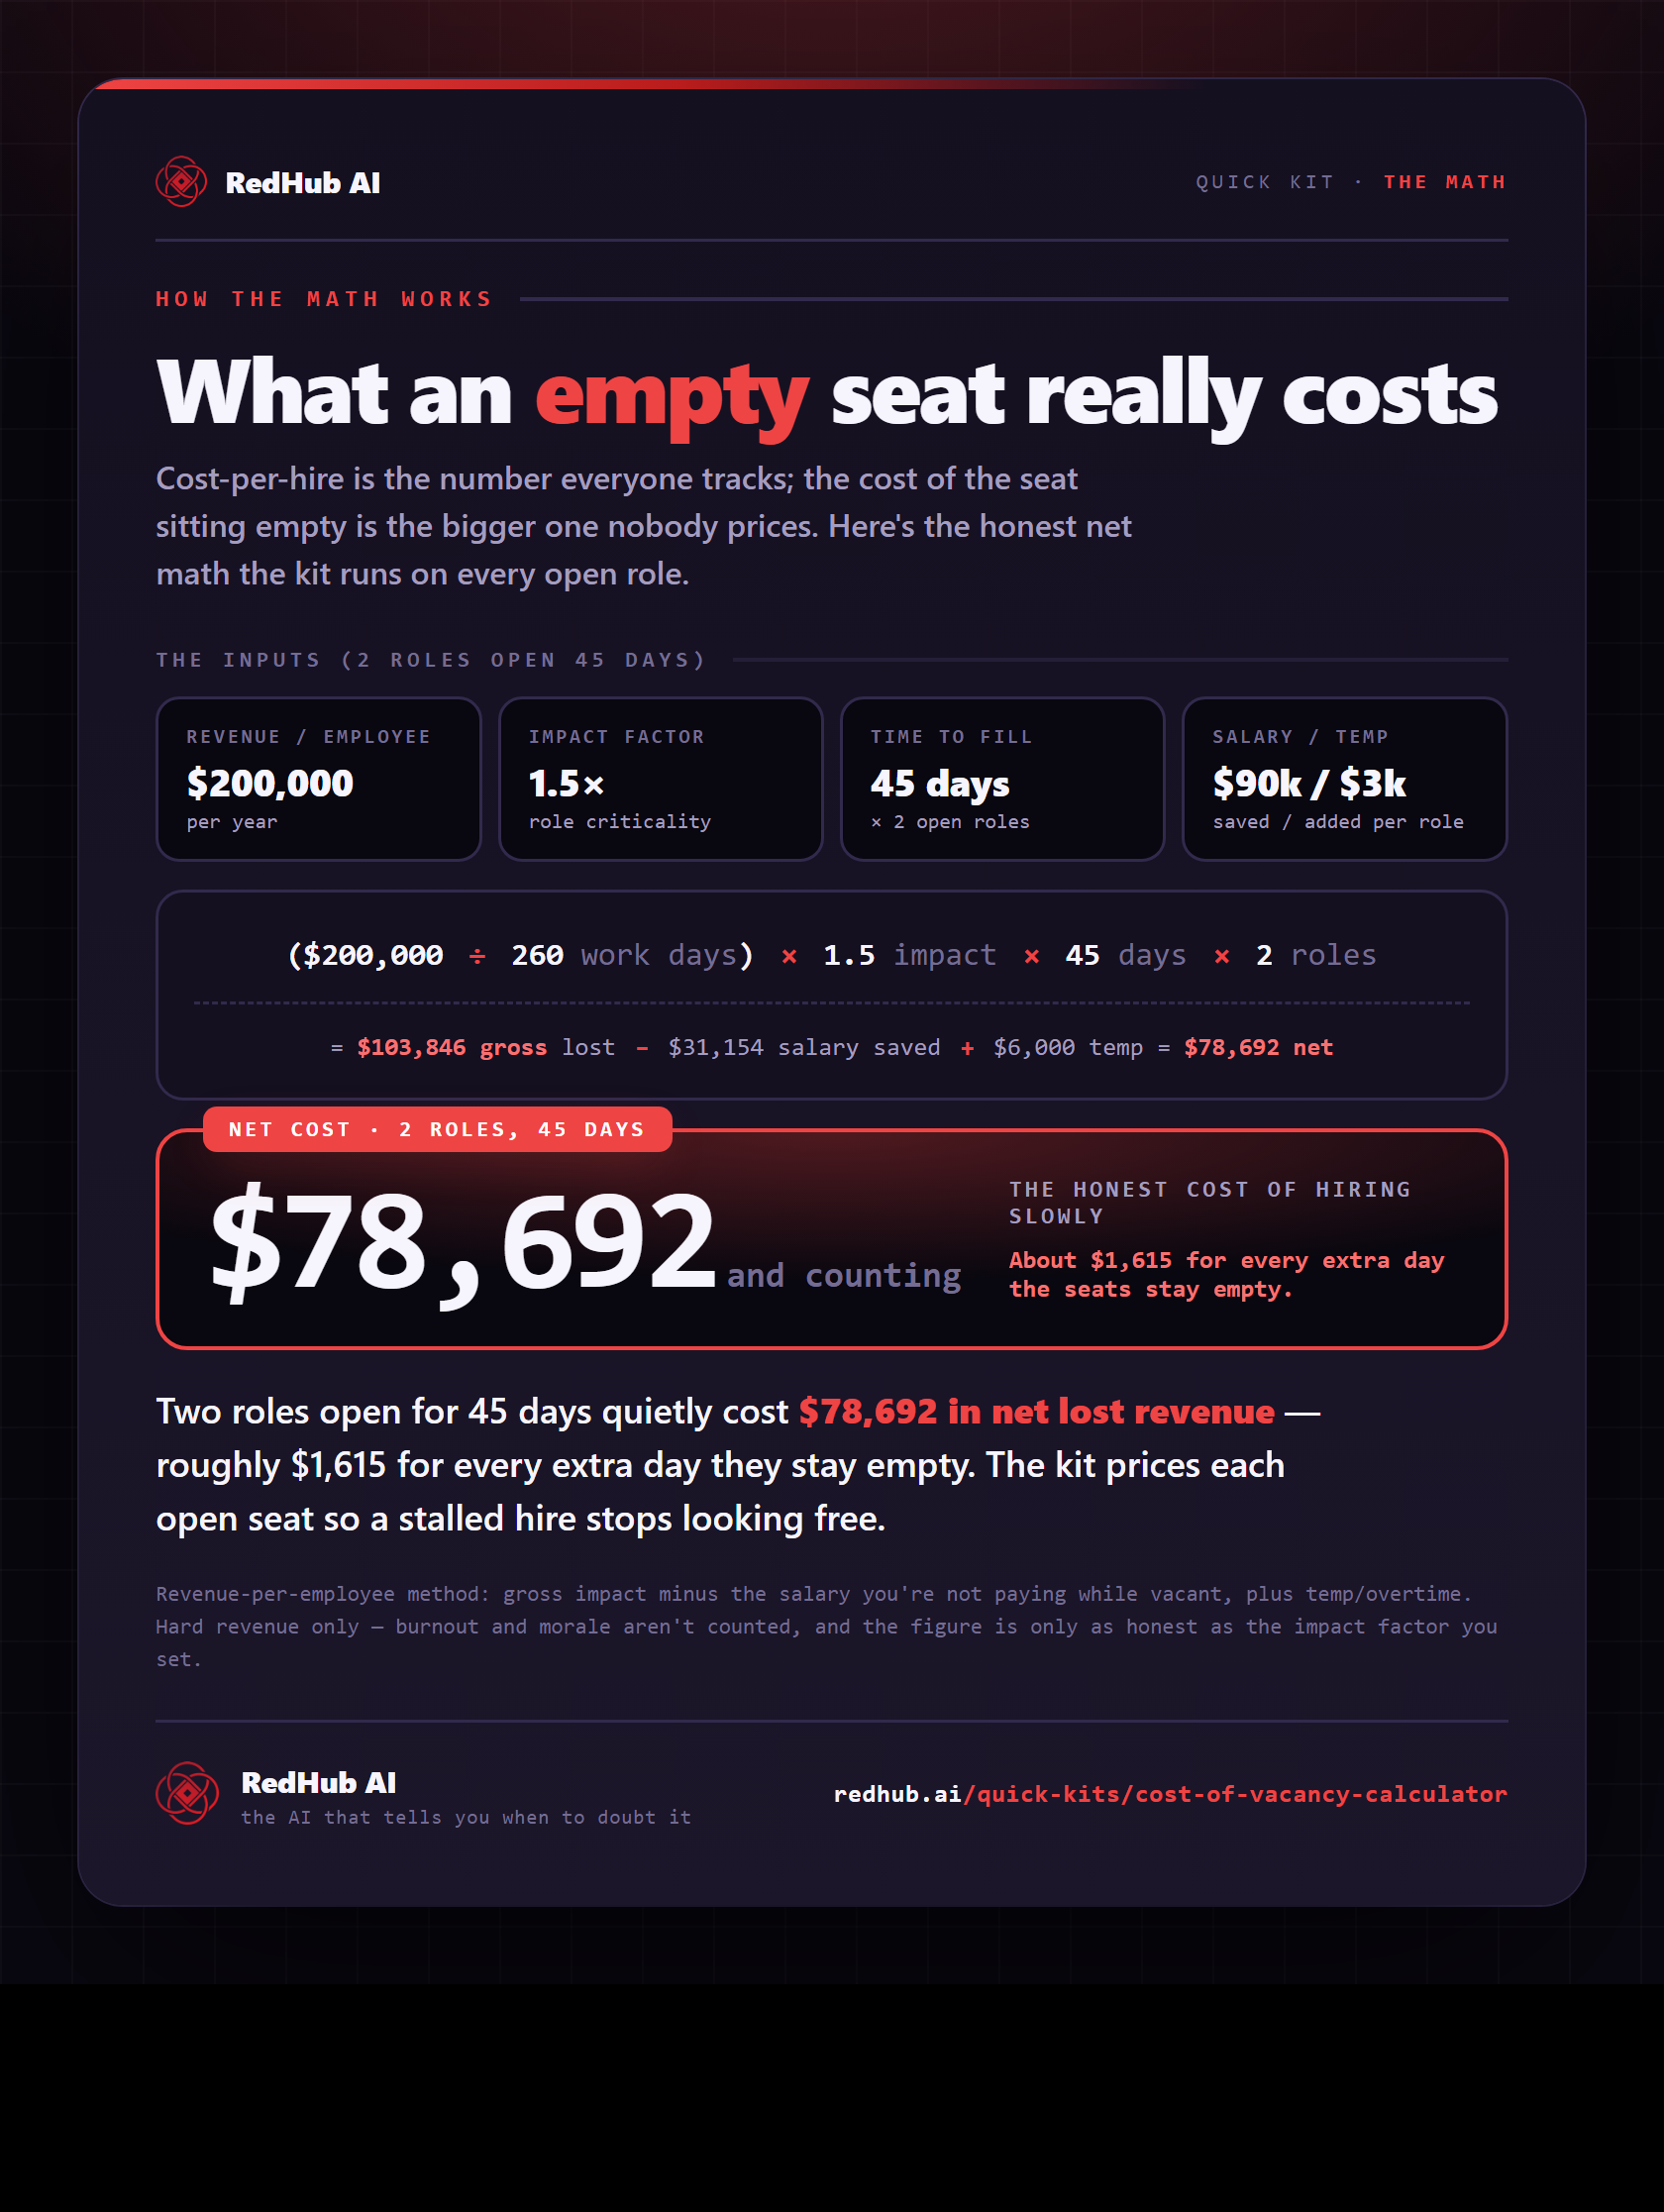
The math behind it, in one image
See the real cost of an open seat: gross revenue impact minus salary saved — 2 roles open 45 days net $78,692, about $1,615 a day.
See the full calculationWhy it's different
A number a CFO will accept
Nets out salary saved
The line most calculators skip — you're not paying the salary while the seat's open, so an honest figure subtracts it instead of inflating the headline.
Impact factor you defend
Criticality is a lever you set by role, not a hidden assumption — keep it defensible and the number survives scrutiny.
Hard costs, stated plainly
It counts revenue impact and temp/overtime and openly excludes burnout and morale — real, but not something this kit pretends to quantify.
“We'll fill it when we find the right person” sounds prudent until you price the seat. Most open roles cost more per day than the rush to fill them ever would.
Shorten time-to-fill with the Recruiting & Hiring Skills Pack, the Local Service & Trades Skills Pack, and the Fractional Executives & Consultants playbooks.
Who it's for
Clear about the lane. No inflated promises.
Built for you if…
- You're making the case for hiring resources or backfill speed
- You run lean — agency, trades, or a revenue-critical seat is open
- You can estimate revenue per employee and a role's impact factor
- You want a net figure that survives a CFO's questions
Not for you if…
- You want soft costs (burnout, morale) quantified — this counts hard dollars only
- You can't estimate revenue per employee even roughly
- You need a full workforce-planning model, not a fast per-role read
Common Questions
The questions recruiters and owners actually ask before they make the case.
An interactive spreadsheet (a Quick Kit) that puts a dollar figure on unfilled roles. You enter your annual revenue per employee, the role's impact factor, time to fill, and number of open roles; it returns the daily revenue impact, the cost per day of delay, and the gross and net cost of vacancy.
The widely used revenue-based standard: daily revenue impact = (annual revenue per employee ÷ working days, ~260) × an impact factor for the role's criticality. Multiply by days vacant and open roles for the gross cost. The kit then subtracts the salary and benefits you're not paying while the seat is empty, and adds any temp/overtime cost, to give an honest net figure.
A multiplier for how much revenue the role drives: roughly 0.5 for support roles, 1.0 for standard, 1.5–2 for high-impact, and 2–3 for revenue-critical roles like sales or billable staff. You set it. It's the honest lever — inflate it and the number lies to you, so the kit asks you to keep it defensible.
They do, and that's how they overstate. While a role is vacant, you're not paying its salary or benefits, so an honest cost of vacancy nets that saving out (and adds temp/overtime to cover). The result is a number you can defend to a CFO, not a scary headline. It still deliberately leaves out soft costs — burnout, overtime fatigue, morale — which are real but not quantified here.
Recruiters and TA teams making the case for hiring resources, agency and trades owners running lean, and fractional execs advising on headcount. It's especially sharp for revenue-generating roles where every open day has a clear cost — like an unfilled technician seat or a sales role.
A single polished spreadsheet (.xlsx) with three tabs: Start Here, a Dashboard, and the Cost of Vacancy Calculator (works in Excel, Google Sheets, or Numbers). Once you've quantified the cost, the Recruiting & Hiring pack, the Local Service & Trades pack, and fractional-exec playbooks help you shorten time-to-fill. One-time purchase, lifetime access plus 12 months of updates.
Get the kit
Make the case to hire — with a number.
Instant download, yours to keep, 12 months of updates. It turns “we should fill this” into “this seat costs us $X a day.”
- 3-tab .xlsx: Start Here, Dashboard, Cost of Vacancy Calculator
- Daily revenue impact, cost per day of delay, gross + net cost
- Honest net math — salary saved netted out, temp/overtime added
- Works in Excel, Google Sheets, or Numbers · 30-day guarantee